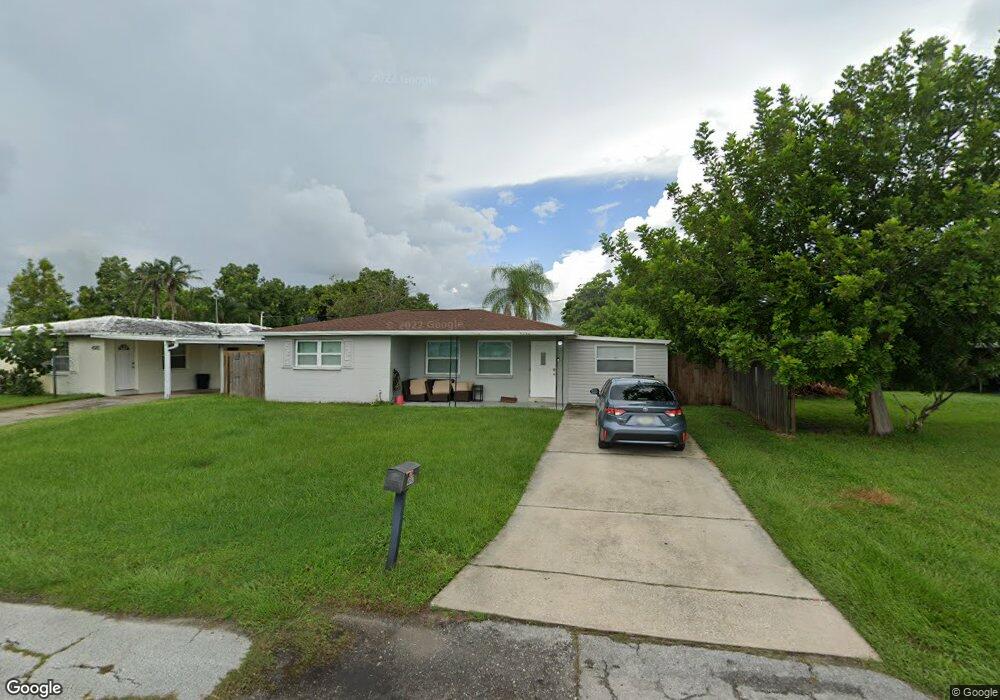
4542 25th St N Saint Petersburg, FL 33714
Estimated Value: $303,000 - $370,000
3
Beds
1
Bath
1,401
Sq Ft
$237/Sq Ft
Est. Value
About This Home
This home is located at 4542 25th St N, Saint Petersburg, FL 33714 and is currently estimated at $332,165, approximately $237 per square foot. 4542 25th St N is a home located in Pinellas County with nearby schools including New Heights Elementary School, Tyrone Middle School, and St. Petersburg High School.
Ownership History
Date
Name
Owned For
Owner Type
Purchase Details
Closed on
Jun 12, 2023
Sold by
Truong Quyen V and Truong Lan H
Bought by
Truong Quyen V and Truong Quyen V
Current Estimated Value
Purchase Details
Closed on
Dec 3, 2010
Sold by
Phung Steven
Bought by
Truong Quyen
Purchase Details
Closed on
Apr 15, 2005
Sold by
Shenefiel Lynda G and Shenefiel Troy
Bought by
Phung Steven
Home Financials for this Owner
Home Financials are based on the most recent Mortgage that was taken out on this home.
Original Mortgage
$126,400
Interest Rate
7.87%
Mortgage Type
Fannie Mae Freddie Mac
Purchase Details
Closed on
Apr 4, 2000
Sold by
Findley L Miriam
Bought by
Demint Lynda G
Create a Home Valuation Report for This Property
The Home Valuation Report is an in-depth analysis detailing your home's value as well as a comparison with similar homes in the area
Home Values in the Area
Average Home Value in this Area
Purchase History
| Date | Buyer | Sale Price | Title Company |
|---|---|---|---|
| Truong Quyen V | $100 | None Listed On Document | |
| Truong Quyen V | $100 | None Listed On Document | |
| Truong Quyen | $38,000 | Alpha Omega Title Services I | |
| Phung Steven | $158,000 | Superior Title & Escrow | |
| Demint Lynda G | $55,900 | -- |
Source: Public Records
Mortgage History
| Date | Status | Borrower | Loan Amount |
|---|---|---|---|
| Previous Owner | Phung Steven | $126,400 | |
| Previous Owner | Demint Lynda G | $19,000 | |
| Previous Owner | Demint Lynda G | $56,556 | |
| Previous Owner | Demint Lynda G | $55,818 | |
| Previous Owner | Demint Lynda G | $55,240 |
Source: Public Records
Tax History Compared to Growth
Tax History
| Year | Tax Paid | Tax Assessment Tax Assessment Total Assessment is a certain percentage of the fair market value that is determined by local assessors to be the total taxable value of land and additions on the property. | Land | Improvement |
|---|---|---|---|---|
| 2024 | $4,531 | $276,219 | $161,899 | $114,320 |
| 2023 | $4,531 | $276,812 | $173,814 | $102,998 |
| 2022 | $3,965 | $215,484 | $137,263 | $78,221 |
| 2021 | $3,671 | $174,472 | $0 | $0 |
| 2020 | $3,302 | $142,990 | $0 | $0 |
| 2019 | $3,124 | $140,919 | $60,689 | $80,230 |
| 2018 | $2,849 | $122,417 | $0 | $0 |
| 2017 | $2,612 | $105,587 | $0 | $0 |
| 2016 | $2,311 | $94,299 | $0 | $0 |
| 2015 | $2,121 | $82,810 | $0 | $0 |
| 2014 | $1,951 | $74,216 | $0 | $0 |
Source: Public Records
Map
Nearby Homes
- 2625 46th Ave N
- 2701 47th Ave N
- 2644 42nd Ave N
- 4000 24th St N Unit 1312
- 4000 24th St N Unit 1419
- 4000 24th St N Unit 274
- 4000 24th St N Unit 474
- 4000 24th St N Unit 1206
- 4000 24th St N Unit 912
- 4000 24th St N Unit 154
- 4000 24th St N Unit 460
- 4000 24th St N Unit 271
- 4000 24th St N Unit 309
- 4000 24th St N Unit 476
- 4000 24th St N Unit 402
- 4000 24th St N Unit 907
- 4000 24th St N Unit 567
- 4000 24th St N Unit 554
- 4000 24th St N Unit 176
- 4000 24th St N Unit 204
- 4520 25th St N
- 2530 46th Ave N
- 2514 46th Ave N
- 2546 46th Ave N
- 2562 46th Ave N
- 2586 46th Ave N
- 2531 46th Ave N
- 2515 46th Ave N
- 2594 46th Ave N
- 2547 46th Ave N
- 2563 46th Ave N
- 2579 46th Ave N
- 2612 46th Ave N
- 2595 46th Ave N
- 2528 46th Terrace N
- 4632 25th St N
- 2542 46th Terrace N
- 2624 46th Ave N
- 2556 46th Terrace N
- 2613 46th Ave N