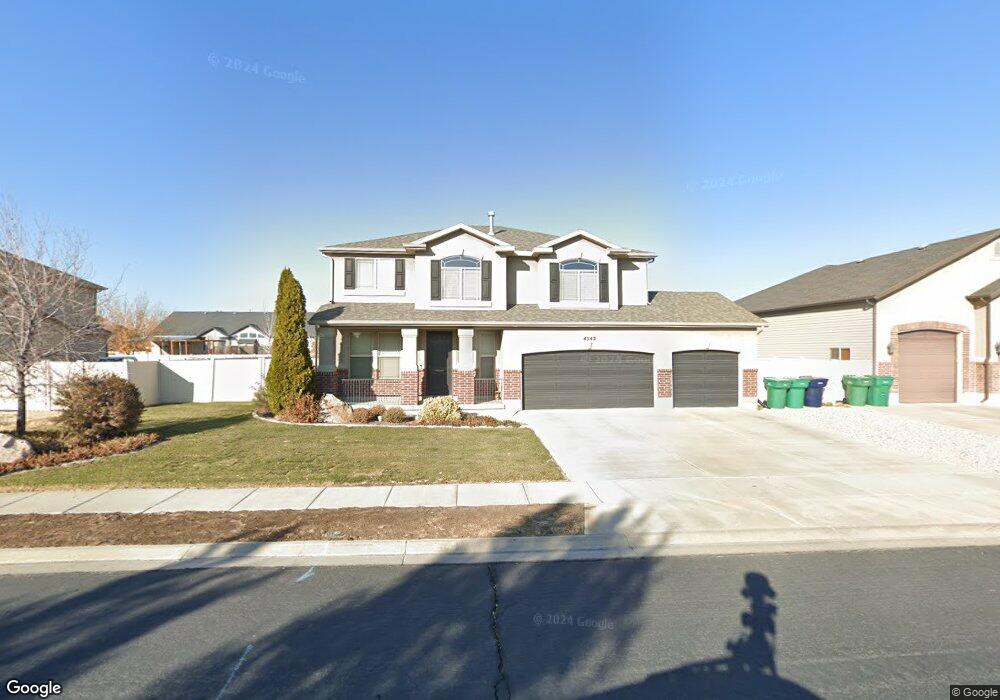
4542 W 5850 S Hooper, UT 84315
Estimated Value: $559,487 - $597,000
4
Beds
3
Baths
2,510
Sq Ft
$232/Sq Ft
Est. Value
About This Home
This home is located at 4542 W 5850 S, Hooper, UT 84315 and is currently estimated at $583,122, approximately $232 per square foot. 4542 W 5850 S is a home located in Weber County with nearby schools including Freedom School, Roy Junior High School, and Roy High School.
Ownership History
Date
Name
Owned For
Owner Type
Purchase Details
Closed on
Jun 26, 2019
Sold by
Stephens Gavin and Stephens Brooke
Bought by
Semrow Kyle and Semrow Keely L
Current Estimated Value
Purchase Details
Closed on
Aug 28, 2007
Sold by
Woodside Wildwood Llc
Bought by
Stephens Gavin and Stephens Brooke
Home Financials for this Owner
Home Financials are based on the most recent Mortgage that was taken out on this home.
Original Mortgage
$171,000
Interest Rate
6.67%
Mortgage Type
Purchase Money Mortgage
Create a Home Valuation Report for This Property
The Home Valuation Report is an in-depth analysis detailing your home's value as well as a comparison with similar homes in the area
Home Values in the Area
Average Home Value in this Area
Purchase History
| Date | Buyer | Sale Price | Title Company |
|---|---|---|---|
| Semrow Kyle | -- | Cottonwood Title Ins Agcy | |
| Stephens Gavin | -- | U S Title Of Utah Ogden |
Source: Public Records
Mortgage History
| Date | Status | Borrower | Loan Amount |
|---|---|---|---|
| Previous Owner | Stephens Gavin | $171,000 |
Source: Public Records
Tax History Compared to Growth
Tax History
| Year | Tax Paid | Tax Assessment Tax Assessment Total Assessment is a certain percentage of the fair market value that is determined by local assessors to be the total taxable value of land and additions on the property. | Land | Improvement |
|---|---|---|---|---|
| 2025 | $3,284 | $523,171 | $196,356 | $326,815 |
| 2024 | $3,320 | $296,999 | $107,995 | $189,004 |
| 2023 | $3,225 | $286,000 | $107,874 | $178,126 |
| 2022 | $3,316 | $303,600 | $83,095 | $220,505 |
| 2021 | $2,805 | $430,000 | $105,965 | $324,035 |
| 2020 | $2,656 | $374,000 | $100,971 | $273,029 |
| 2019 | $2,582 | $343,000 | $100,654 | $242,346 |
| 2018 | $2,436 | $308,000 | $65,619 | $242,381 |
| 2017 | $2,321 | $283,000 | $65,543 | $217,457 |
| 2016 | $2,191 | $143,657 | $35,936 | $107,721 |
| 2015 | $2,107 | $135,716 | $33,125 | $102,591 |
| 2014 | $1,896 | $117,633 | $27,641 | $89,992 |
Source: Public Records
Map
Nearby Homes