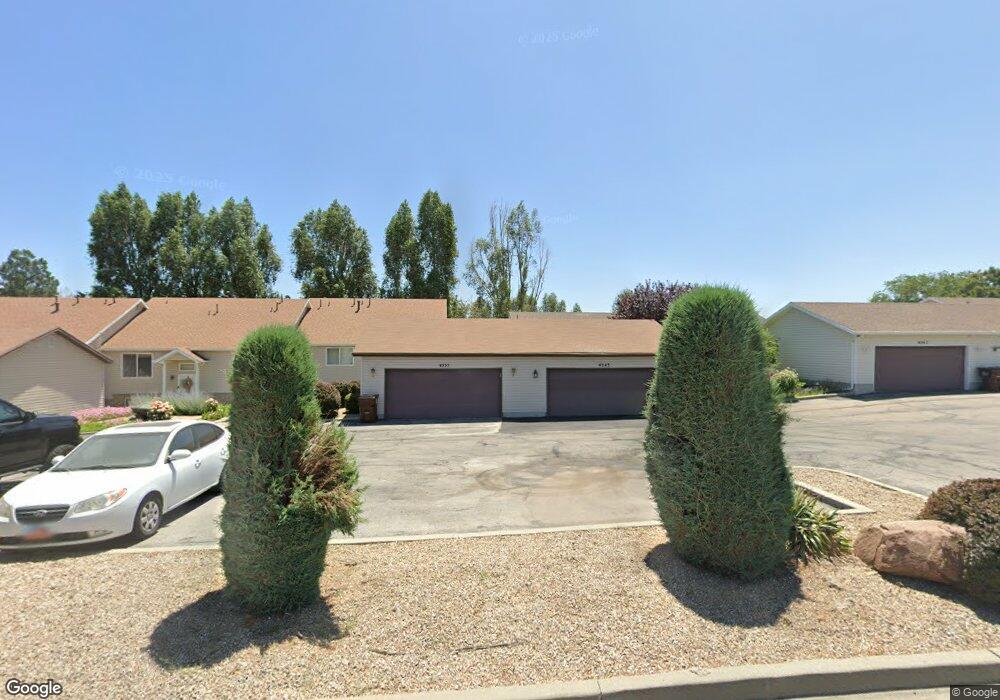
4543 W Saint Andrews Dr South Jordan, UT 84095
Glenmoor Country Estates NeighborhoodEstimated Value: $470,528 - $519,000
4
Beds
3
Baths
2,744
Sq Ft
$180/Sq Ft
Est. Value
About This Home
This home is located at 4543 W Saint Andrews Dr, South Jordan, UT 84095 and is currently estimated at $494,632, approximately $180 per square foot. 4543 W Saint Andrews Dr is a home located in Salt Lake County with nearby schools including Welby Elementary School, Elk Ridge Middle School, and Itineris Early College High School.
Ownership History
Date
Name
Owned For
Owner Type
Purchase Details
Closed on
Apr 14, 2010
Sold by
Montoya Gilbert E and Montoya Susie P
Bought by
Montoya Gilbert E
Current Estimated Value
Home Financials for this Owner
Home Financials are based on the most recent Mortgage that was taken out on this home.
Original Mortgage
$119,000
Outstanding Balance
$38,413
Interest Rate
4.95%
Mortgage Type
New Conventional
Estimated Equity
$456,219
Purchase Details
Closed on
Oct 15, 2002
Sold by
Montoya Gilbert E and Montoya Susie P
Bought by
Montoya Gilbert E and Montoya Susie P
Purchase Details
Closed on
Sep 21, 2002
Sold by
Montoya Gilbert E and Montoya Susie P
Bought by
Montoya Gilbert E and Montoya Susie P
Purchase Details
Closed on
Apr 9, 1999
Sold by
Lindstrom Larry B
Bought by
Montoya Gilbert and Montoya Susie
Home Financials for this Owner
Home Financials are based on the most recent Mortgage that was taken out on this home.
Original Mortgage
$90,000
Interest Rate
7.04%
Mortgage Type
Purchase Money Mortgage
Purchase Details
Closed on
Mar 11, 1998
Sold by
Washburn J B
Bought by
Lindstrom Larry B
Create a Home Valuation Report for This Property
The Home Valuation Report is an in-depth analysis detailing your home's value as well as a comparison with similar homes in the area
Home Values in the Area
Average Home Value in this Area
Purchase History
| Date | Buyer | Sale Price | Title Company |
|---|---|---|---|
| Montoya Gilbert E | -- | Hickman Land Title Co | |
| Montoya Gilbert E | -- | -- | |
| Montoya Gilbert E | -- | Backman Stewart Title Servic | |
| Montoya Gilbert | -- | First American Title | |
| Lindstrom Larry B | -- | First American Title |
Source: Public Records
Mortgage History
| Date | Status | Borrower | Loan Amount |
|---|---|---|---|
| Open | Montoya Gilbert E | $119,000 | |
| Closed | Montoya Gilbert | $90,000 |
Source: Public Records
Tax History Compared to Growth
Tax History
| Year | Tax Paid | Tax Assessment Tax Assessment Total Assessment is a certain percentage of the fair market value that is determined by local assessors to be the total taxable value of land and additions on the property. | Land | Improvement |
|---|---|---|---|---|
| 2025 | $2,326 | $452,500 | $67,600 | $384,900 |
| 2024 | $2,326 | $441,700 | $66,300 | $375,400 |
| 2023 | $2,582 | $462,600 | $64,400 | $398,200 |
| 2022 | $2,629 | $461,600 | $63,100 | $398,500 |
| 2021 | $1,983 | $319,500 | $49,200 | $270,300 |
| 2020 | $1,989 | $300,400 | $49,200 | $251,200 |
| 2019 | $1,919 | $284,900 | $46,400 | $238,500 |
| 2018 | $1,670 | $246,600 | $46,400 | $200,200 |
| 2017 | $1,553 | $224,800 | $46,400 | $178,400 |
| 2016 | $1,649 | $226,200 | $67,900 | $158,300 |
| 2015 | $1,575 | $210,000 | $69,200 | $140,800 |
| 2014 | $1,508 | $197,600 | $66,000 | $131,600 |
Source: Public Records
Map
Nearby Homes
- 4554 Birdie Way
- 4424 W Skye Dr
- 10027 Birdie Way
- 10117 S Glenmoor Dr
- 4565 Lennox Dr
- 4208 W Chestnut View Dr
- 4722 W Vermillion Dr
- 10308 S Rubicon Rd
- 4058 W Ascot Downs Dr
- 9871 S 4000 W
- 4722 W Noyo Ln
- 9353 S 4460 W
- 9941 Birnam Woods Way
- 4712 W South Jordan Pkwy
- 4523 W South Jordan Pkwy
- 4438 W South Jordan Pkwy
- 10426 S Millerton Dr
- 3908 W Graymalkin Cir
- 4707 W Granada Hills Ct
- 4801 W South Jordan Pkwy
- 4547 Saint Andrews Dr
- 4543 W Saint Andrews Dr
- 4543 W St Andrews Dr
- 4535 W Saint Andrews Dr
- 4535 W Saint Andrews Dr
- 4529 W Saint Andrews Dr
- 4529 Saint Andrews Dr
- 4561 W Saint Andrews Dr
- 4525 Saint Andrews Dr
- 4525 W Saint Andrews Dr
- 4561 W Saint Andrews Dr
- 4567 Saint Andrews Dr
- 4567 W Saint Andrews Dr
- 4517 Saint Andrews Dr
- 4513 Saint Andrews Dr
- 4575 Saint Andrews Dr
- 4579 Saint Andrews Dr
- 4507 Saint Andrews Dr
- 4507 W Saint Andrews Dr
- 9912 Birdie Way