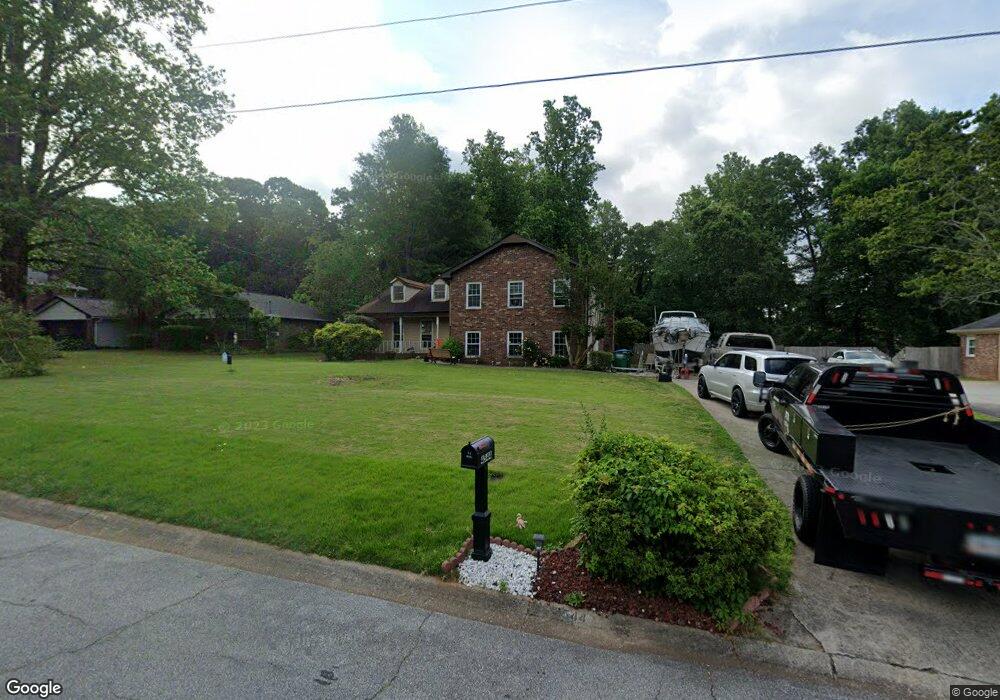
4544 Cinco Dr SW Unit 2 Lilburn, GA 30047
Estimated Value: $380,000 - $407,000
4
Beds
3
Baths
1,560
Sq Ft
$250/Sq Ft
Est. Value
About This Home
This home is located at 4544 Cinco Dr SW Unit 2, Lilburn, GA 30047 and is currently estimated at $390,601, approximately $250 per square foot. 4544 Cinco Dr SW Unit 2 is a home located in Gwinnett County with nearby schools including Camp Creek Elementary School, Trickum Middle School, and Parkview High School.
Ownership History
Date
Name
Owned For
Owner Type
Purchase Details
Closed on
Dec 27, 2004
Sold by
Mcbean Stephen
Bought by
Mcbean Stephen and Mcbean Lorna
Current Estimated Value
Home Financials for this Owner
Home Financials are based on the most recent Mortgage that was taken out on this home.
Original Mortgage
$16,500
Interest Rate
5.08%
Mortgage Type
New Conventional
Purchase Details
Closed on
Mar 15, 1999
Sold by
Mcbean Stephen A
Bought by
Lorna Mcbean S and Lorna Wlliams
Home Financials for this Owner
Home Financials are based on the most recent Mortgage that was taken out on this home.
Original Mortgage
$112,500
Interest Rate
6.74%
Mortgage Type
New Conventional
Purchase Details
Closed on
Jun 25, 1993
Sold by
Willhite Jerrald I
Bought by
Holmes Mark E
Home Financials for this Owner
Home Financials are based on the most recent Mortgage that was taken out on this home.
Original Mortgage
$106,965
Interest Rate
7.52%
Mortgage Type
FHA
Create a Home Valuation Report for This Property
The Home Valuation Report is an in-depth analysis detailing your home's value as well as a comparison with similar homes in the area
Home Values in the Area
Average Home Value in this Area
Purchase History
| Date | Buyer | Sale Price | Title Company |
|---|---|---|---|
| Mcbean Stephen | -- | -- | |
| Lorna Mcbean S | -- | -- | |
| Mcbean Stephen A | $125,000 | -- | |
| Holmes Mark E | $106,300 | -- |
Source: Public Records
Mortgage History
| Date | Status | Borrower | Loan Amount |
|---|---|---|---|
| Closed | Mcbean Stephen | $16,500 | |
| Open | Mcbean Stephen | $148,500 | |
| Previous Owner | Mcbean Stephen A | $112,500 | |
| Previous Owner | Holmes Mark E | $106,965 |
Source: Public Records
Tax History Compared to Growth
Tax History
| Year | Tax Paid | Tax Assessment Tax Assessment Total Assessment is a certain percentage of the fair market value that is determined by local assessors to be the total taxable value of land and additions on the property. | Land | Improvement |
|---|---|---|---|---|
| 2025 | $3,609 | $139,080 | $26,120 | $112,960 |
| 2024 | $3,671 | $136,280 | $26,120 | $110,160 |
| 2023 | $3,671 | $134,160 | $29,600 | $104,560 |
| 2022 | $3,265 | $118,640 | $25,600 | $93,040 |
| 2021 | $2,911 | $99,320 | $20,000 | $79,320 |
| 2020 | $2,744 | $90,560 | $16,000 | $74,560 |
| 2019 | $2,415 | $77,880 | $12,000 | $65,880 |
| 2018 | $2,415 | $77,880 | $12,000 | $65,880 |
| 2016 | $2,176 | $65,760 | $12,000 | $53,760 |
| 2015 | $2,191 | $65,760 | $12,000 | $53,760 |
| 2014 | $2,199 | $65,760 | $12,000 | $53,760 |
Source: Public Records
Map
Nearby Homes
- 1296 Lake Lucerne Rd SW
- 4665 Redspruce Dr SW
- 1337 Arlene Ct SW
- 1276 Hickory Dr SW
- 1178 Carla Joe Dr SW
- 4327 Saint Michaels Dr SW
- 1530 Oleander Ln SW
- 1348 Ridgewood Dr SW
- 4377 Hardwood Cir SW Unit 2
- 1296 Mandalay Ct SW
- 1102 Timber Glen Ct SW
- 450 Rockfern Ct
- 460 Rockfern Ct Unit 14A
- 1527 Ridgewood Dr SW
- 1461 Fox Forest Terrace SW
- 4405 Bending River Trail SW
- 4554 Cinco Dr SW
- 4534 Cinco Dr SW
- 4541 Ridgeland Dr SW
- 4524 Cinco Dr SW
- 4531 Ridgeland Dr SW
- 4564 Cinco Dr SW
- 4551 Ridgeland Dr SW
- 4543 Cinco Dr SW Unit 2
- 4521 Ridgeland Dr SW
- 4553 Cinco Dr SW
- 4561 Ridgeland Dr SW Unit 1
- 4514 Cinco Dr SW Unit 2
- 1362 Fireside Ct SW Unit 2
- 0 Fireside Ct Unit 8610637
- 0 Fireside Ct
- 4574 Cinco Dr SW
- 4613 Cinco Dr SW Unit 2
- 4511 Ridgeland Dr SW Unit 1
- 4571 Ridgeland Dr SW
- 1351 Fireside Ct SW