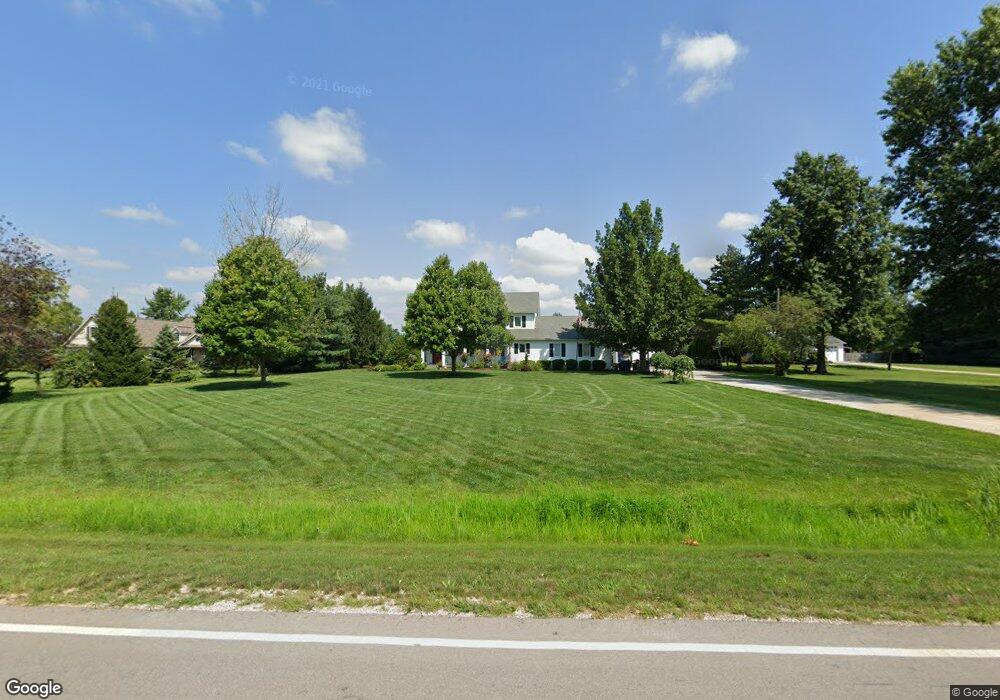
4544 Clark Shaw Rd Powell, OH 43065
Concord NeighborhoodEstimated Value: $604,000 - $734,000
4
Beds
3
Baths
3,006
Sq Ft
$219/Sq Ft
Est. Value
About This Home
This home is located at 4544 Clark Shaw Rd, Powell, OH 43065 and is currently estimated at $659,707, approximately $219 per square foot. 4544 Clark Shaw Rd is a home located in Delaware County with nearby schools including Buckeye Valley High School and The Emilia School.
Ownership History
Date
Name
Owned For
Owner Type
Purchase Details
Closed on
Aug 30, 2011
Sold by
Pridham Evan and Pridham Sabrina
Bought by
Brown Nicholas Scott and Brown Chritina Louise
Current Estimated Value
Home Financials for this Owner
Home Financials are based on the most recent Mortgage that was taken out on this home.
Original Mortgage
$303,905
Outstanding Balance
$211,266
Interest Rate
4.58%
Mortgage Type
New Conventional
Estimated Equity
$448,441
Purchase Details
Closed on
Nov 12, 1998
Sold by
Palmer Const Inc
Bought by
Pridham Evan and Pridham Sabrina
Home Financials for this Owner
Home Financials are based on the most recent Mortgage that was taken out on this home.
Original Mortgage
$196,000
Interest Rate
6.68%
Mortgage Type
New Conventional
Purchase Details
Closed on
Sep 10, 1997
Sold by
Carbonera Investments Lt
Bought by
Palmer Const Inc
Home Financials for this Owner
Home Financials are based on the most recent Mortgage that was taken out on this home.
Original Mortgage
$33,000
Interest Rate
7.44%
Mortgage Type
New Conventional
Create a Home Valuation Report for This Property
The Home Valuation Report is an in-depth analysis detailing your home's value as well as a comparison with similar homes in the area
Home Values in the Area
Average Home Value in this Area
Purchase History
| Date | Buyer | Sale Price | Title Company |
|---|---|---|---|
| Brown Nicholas Scott | $319,900 | Attorney | |
| Pridham Evan | $245,883 | -- | |
| Palmer Const Inc | $39,000 | -- |
Source: Public Records
Mortgage History
| Date | Status | Borrower | Loan Amount |
|---|---|---|---|
| Open | Brown Nicholas Scott | $303,905 | |
| Previous Owner | Pridham Evan | $196,000 | |
| Previous Owner | Palmer Const Inc | $33,000 |
Source: Public Records
Tax History Compared to Growth
Tax History
| Year | Tax Paid | Tax Assessment Tax Assessment Total Assessment is a certain percentage of the fair market value that is determined by local assessors to be the total taxable value of land and additions on the property. | Land | Improvement |
|---|---|---|---|---|
| 2024 | $5,955 | $172,280 | $40,570 | $131,710 |
| 2023 | $5,949 | $172,280 | $40,570 | $131,710 |
| 2022 | $5,683 | $148,510 | $29,400 | $119,110 |
| 2021 | $5,685 | $148,510 | $29,400 | $119,110 |
| 2020 | $5,721 | $148,510 | $29,400 | $119,110 |
| 2019 | $4,914 | $116,830 | $24,500 | $92,330 |
| 2018 | $4,992 | $116,830 | $24,500 | $92,330 |
| 2017 | $4,718 | $113,580 | $19,390 | $94,190 |
| 2016 | $4,552 | $113,580 | $19,390 | $94,190 |
| 2015 | $4,794 | $113,580 | $19,390 | $94,190 |
| 2014 | $4,517 | $113,580 | $19,390 | $94,190 |
| 2013 | $4,491 | $109,100 | $19,390 | $89,710 |
Source: Public Records
Map
Nearby Homes
- 5310 S Section Line Rd
- 4161 Clark Shaw Rd
- 5968 S Section Line Rd
- 4040 Clark Shaw Rd
- 4132 Bluebird Dr
- 4142 Pyke Dr
- 6299 S Section Line Rd
- 0 S Section Line Rd Unit Tract 6 225024549
- 0 S Section Line Rd Unit Tract 5 225024546
- 0 S Section Line Rd Unit Tract 4B 225024545
- 0 S Section Line Rd Unit Tract 4A 225024542
- 0 S Section Line Rd Unit Tract 3 225024539
- 0 S Section Line Rd Unit Tract 2B 225024538
- 0 S Section Line Rd Unit Tract 2A 225024534
- 0 S Section Line Rd Unit Tract 1 225024531
- 0 Clark-Shaw Rd Unit 225020834
- 5229 Bean Oller Rd
- 5701 Dublin Rd
- 4140 Copeland Ct
- 5786 Shadowfair Ln
- 4572 Clark Shaw Rd
- 4532 Clark Shaw Rd
- 4600 Clark Shaw Rd
- 5483 S Section Line Rd
- 4617 Clark Shaw Rd
- 4511 Clark Shaw Rd
- 4479 Clark-Shaw Rd
- 4422 Clark Shaw Rd
- 4479 Clark Shaw Rd
- 5505 S Section Line Rd
- 4664 Clark Shaw Rd
- 4659 Clark Shaw Rd
- 4420 Clark-Shaw Rd
- 5475 S Section Line Rd
- 4420 Clark Shaw Rd
- 4433 Clark Shaw Rd
- 4486 Clark Shaw Rd
- 5621 S Section Line Rd
- 5439 S Section Line Rd
- 4499 Clark Shaw Rd