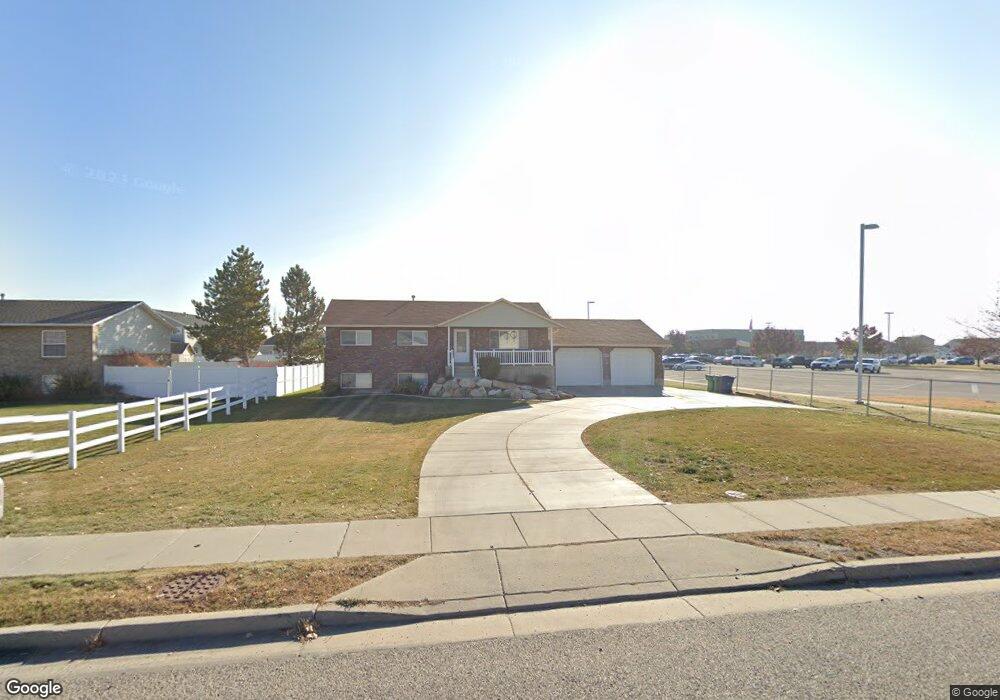
4545 W 5500 S Unit 109 Hooper, UT 84315
Estimated Value: $429,000 - $473,000
3
Beds
2
Baths
1,151
Sq Ft
$395/Sq Ft
Est. Value
About This Home
This home is located at 4545 W 5500 S Unit 109, Hooper, UT 84315 and is currently estimated at $454,785, approximately $395 per square foot. 4545 W 5500 S Unit 109 is a home located in Weber County with nearby schools including Freedom School, Roy Junior High School, and Roy High School.
Ownership History
Date
Name
Owned For
Owner Type
Purchase Details
Closed on
Jan 29, 2013
Sold by
Barker Randy W and Barker Tracey Winikerel
Bought by
Barker Randy W and Barker Tracey B
Current Estimated Value
Home Financials for this Owner
Home Financials are based on the most recent Mortgage that was taken out on this home.
Original Mortgage
$133,500
Outstanding Balance
$92,978
Interest Rate
3.33%
Mortgage Type
New Conventional
Estimated Equity
$361,807
Purchase Details
Closed on
Oct 20, 2008
Sold by
Barker Randy W and Ronald Barker E
Bought by
Barker Randy W and Barker Tracey Winikerei
Purchase Details
Closed on
May 31, 2006
Sold by
Barker Randy W
Bought by
Barker Randy W and Ronald Barker E
Purchase Details
Closed on
Nov 2, 2005
Sold by
Larsen Brad S and Tremelling Janet M
Bought by
Barker Randy William and Ronald Barker E
Create a Home Valuation Report for This Property
The Home Valuation Report is an in-depth analysis detailing your home's value as well as a comparison with similar homes in the area
Home Values in the Area
Average Home Value in this Area
Purchase History
| Date | Buyer | Sale Price | Title Company |
|---|---|---|---|
| Barker Randy W | -- | Bonneville Superior Title Co | |
| Barker Randy W | -- | None Available | |
| Barker Randy W | -- | Bonneville Superior Title Co | |
| Barker Randy William | -- | -- |
Source: Public Records
Mortgage History
| Date | Status | Borrower | Loan Amount |
|---|---|---|---|
| Open | Barker Randy W | $133,500 |
Source: Public Records
Tax History Compared to Growth
Tax History
| Year | Tax Paid | Tax Assessment Tax Assessment Total Assessment is a certain percentage of the fair market value that is determined by local assessors to be the total taxable value of land and additions on the property. | Land | Improvement |
|---|---|---|---|---|
| 2025 | $2,603 | $420,439 | $215,345 | $205,094 |
| 2024 | $2,608 | $237,049 | $118,439 | $118,610 |
| 2023 | $2,551 | $229,350 | $116,723 | $112,627 |
| 2022 | $2,587 | $239,250 | $91,743 | $147,507 |
| 2021 | $2,204 | $340,000 | $120,843 | $219,157 |
| 2020 | $2,059 | $292,000 | $115,733 | $176,267 |
| 2019 | $1,986 | $266,000 | $110,201 | $155,799 |
| 2018 | $1,838 | $234,000 | $74,679 | $159,321 |
| 2017 | $1,661 | $203,000 | $72,230 | $130,770 |
| 2016 | $1,627 | $107,766 | $38,735 | $69,031 |
| 2015 | $1,559 | $101,737 | $35,993 | $65,744 |
| 2014 | $1,412 | $88,632 | $30,962 | $57,670 |
Source: Public Records
Map
Nearby Homes
- 4700 W 5500 S
- 4449 W 5325 S
- 4632 W 5750 S
- 4309 W 5430 St #B S
- 4337 W 5430 S Unit A
- 5539 S 4175 W
- 462 S 4450 W Unit 504
- 5116 S 4300 W
- 5270 S 4200 W
- 4909 W 5850 S
- 5644 S 4075 W
- 5465 S 4050 W
- 4438 W 6025 S
- 4556 W 4950 S
- 5778 S 4075 W
- 4276 W 6025 S
- 4164 W 5950 S
- 4218 W 5050 S
- 5013 S 4150 W
- 4931 S 4700 W