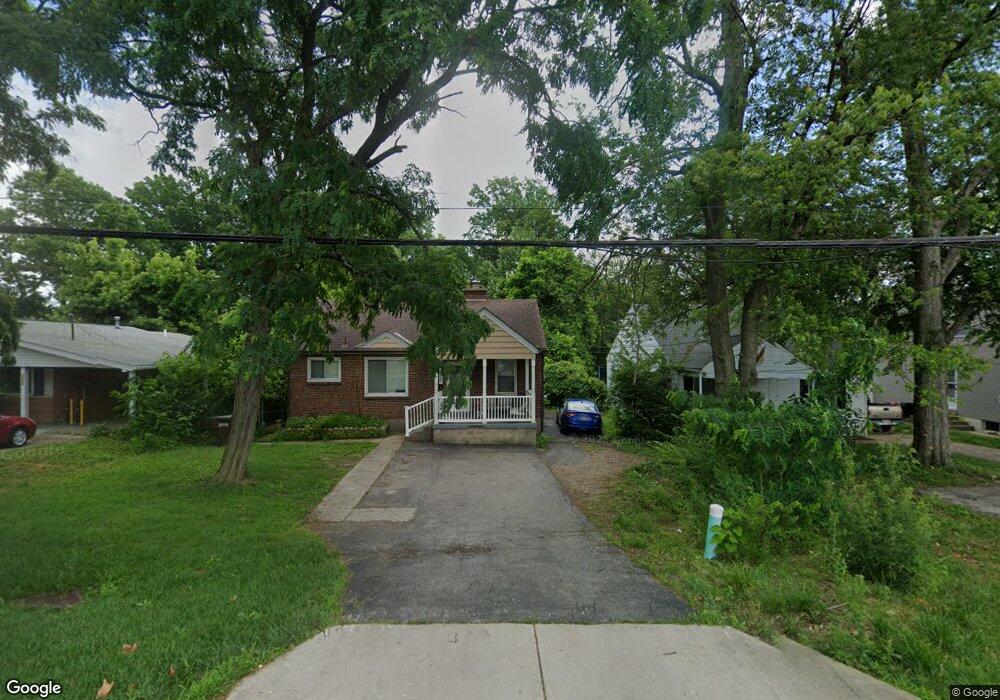
4546 Cooper Rd Cincinnati, OH 45242
Estimated Value: $253,000 - $278,000
2
Beds
1
Bath
884
Sq Ft
$298/Sq Ft
Est. Value
About This Home
This home is located at 4546 Cooper Rd, Cincinnati, OH 45242 and is currently estimated at $263,421, approximately $297 per square foot. 4546 Cooper Rd is a home located in Hamilton County with nearby schools including Edwin H Greene Intermediate Middle School, Sycamore Junior High School, and Sycamore High School.
Ownership History
Date
Name
Owned For
Owner Type
Purchase Details
Closed on
Aug 19, 2009
Sold by
Tussey Edward W
Bought by
Schulte Nicholas Neal
Current Estimated Value
Home Financials for this Owner
Home Financials are based on the most recent Mortgage that was taken out on this home.
Original Mortgage
$93,600
Outstanding Balance
$52,743
Interest Rate
2.99%
Mortgage Type
Adjustable Rate Mortgage/ARM
Estimated Equity
$210,678
Purchase Details
Closed on
Apr 11, 1995
Sold by
Rhoads John L
Bought by
Baldwin Harry F and Baldwin Rogena
Home Financials for this Owner
Home Financials are based on the most recent Mortgage that was taken out on this home.
Original Mortgage
$24,000
Interest Rate
8.79%
Purchase Details
Closed on
Apr 7, 1995
Sold by
Baldwin Harry F and Baldwin Rogena
Bought by
Tussey Edward W
Home Financials for this Owner
Home Financials are based on the most recent Mortgage that was taken out on this home.
Original Mortgage
$24,000
Interest Rate
8.79%
Create a Home Valuation Report for This Property
The Home Valuation Report is an in-depth analysis detailing your home's value as well as a comparison with similar homes in the area
Home Values in the Area
Average Home Value in this Area
Purchase History
| Date | Buyer | Sale Price | Title Company |
|---|---|---|---|
| Schulte Nicholas Neal | $117,000 | Attorney | |
| Baldwin Harry F | -- | -- | |
| Tussey Edward W | -- | -- |
Source: Public Records
Mortgage History
| Date | Status | Borrower | Loan Amount |
|---|---|---|---|
| Open | Schulte Nicholas Neal | $93,600 | |
| Previous Owner | Tussey Edward W | $24,000 |
Source: Public Records
Tax History
| Year | Tax Paid | Tax Assessment Tax Assessment Total Assessment is a certain percentage of the fair market value that is determined by local assessors to be the total taxable value of land and additions on the property. | Land | Improvement |
|---|---|---|---|---|
| 2025 | $2,966 | $68,226 | $32,928 | $35,298 |
| 2024 | $2,898 | $68,226 | $32,928 | $35,298 |
| 2023 | $2,908 | $68,226 | $32,928 | $35,298 |
| 2022 | $2,249 | $43,848 | $12,621 | $31,227 |
| 2021 | $2,205 | $43,848 | $12,621 | $31,227 |
| 2020 | $2,218 | $43,848 | $12,621 | $31,227 |
| 2019 | $2,093 | $38,129 | $10,976 | $27,153 |
| 2018 | $2,004 | $38,129 | $10,976 | $27,153 |
| 2017 | $1,883 | $38,129 | $10,976 | $27,153 |
| 2016 | $2,158 | $42,179 | $11,305 | $30,874 |
| 2015 | $1,902 | $42,179 | $11,305 | $30,874 |
| 2014 | $1,908 | $42,179 | $11,305 | $30,874 |
| 2013 | $1,906 | $40,950 | $10,976 | $29,974 |
Source: Public Records
Map
Nearby Homes
- 4824 Fairview Ave
- 4833 Fairview Ave
- 9689 Cooper Ln
- 9736 Cooper Ln
- 9870 Timbers Dr
- 9348 Towne Square Ave
- 4539 Leslie Ave
- 9966 Timbers Dr
- 9216 Grandview Ave
- 9800 Delray Dr
- 9321 Hunters Creek Dr
- 4236 Parkview Dr
- 4232 Parkview Dr
- 4234 Parkview Dr
- 4230 Parkview Dr
- 4270 Parkview Dr
- 5700 Samstone Ct
- 5056 Arabella Cir
- 4722 Alpine Ave
- 4204 Magnolia Aly
- 4548 Cooper Rd
- 4544 Cooper Rd
- 4543 Cooper Rd
- 4542 Cooper Rd
- 4550 Cooper Rd
- 4552 Cooper Rd
- 4606 Northfield Rd
- 4604 Northfield Rd
- 4554 Cooper Rd
- 4545 Cooper Rd
- 4549 Cooper Rd
- 4556 Cooper Rd
- 4551 Cooper Rd
- 4547 Cooper Rd
- 4553 Cooper Rd
- 4557 Cooper Rd
- 4539 Cooper Rd
- 4614 Northfield Rd
- 4564 Cooper Rd
- 4559 Cooper Rd
Your Personal Tour Guide
Ask me questions while you tour the home.