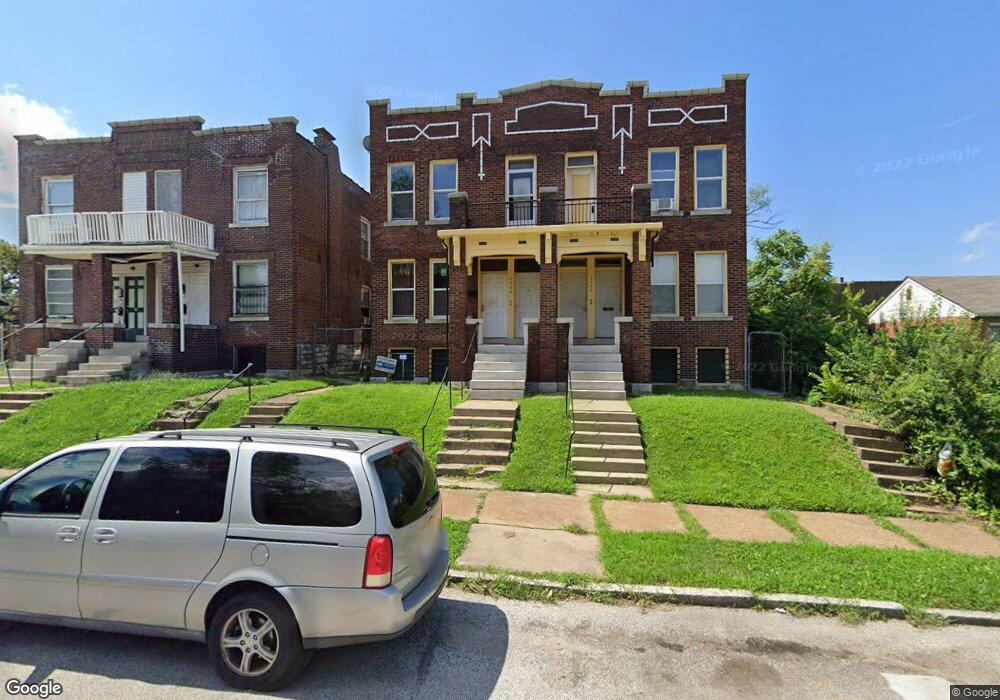
4546 Margaretta Ave Saint Louis, MO 63115
Penrose NeighborhoodEstimated Value: $85,000 - $142,000
--
Bed
4
Baths
3,922
Sq Ft
$28/Sq Ft
Est. Value
About This Home
This home is located at 4546 Margaretta Ave, Saint Louis, MO 63115 and is currently estimated at $109,667, approximately $27 per square foot. 4546 Margaretta Ave is a home located in St. Louis City with nearby schools including Ashland Elementary School, Yeatman-Liddell Middle School, and Sumner High School.
Ownership History
Date
Name
Owned For
Owner Type
Purchase Details
Closed on
May 4, 2005
Sold by
Nyahuma Jawanza O
Bought by
Lee Anwar
Current Estimated Value
Home Financials for this Owner
Home Financials are based on the most recent Mortgage that was taken out on this home.
Original Mortgage
$73,800
Outstanding Balance
$28,750
Interest Rate
2%
Mortgage Type
New Conventional
Estimated Equity
$80,917
Purchase Details
Closed on
Jul 5, 2002
Sold by
Hill Dorothy
Bought by
Nyahuma Jawanza O
Home Financials for this Owner
Home Financials are based on the most recent Mortgage that was taken out on this home.
Original Mortgage
$37,800
Interest Rate
6.76%
Mortgage Type
Purchase Money Mortgage
Purchase Details
Closed on
Oct 23, 2000
Sold by
P Eddie
Bought by
Hill Dorothy
Home Financials for this Owner
Home Financials are based on the most recent Mortgage that was taken out on this home.
Original Mortgage
$36,400
Interest Rate
7.87%
Mortgage Type
Purchase Money Mortgage
Create a Home Valuation Report for This Property
The Home Valuation Report is an in-depth analysis detailing your home's value as well as a comparison with similar homes in the area
Home Values in the Area
Average Home Value in this Area
Purchase History
| Date | Buyer | Sale Price | Title Company |
|---|---|---|---|
| Lee Anwar | -- | U S Title | |
| Nyahuma Jawanza O | -- | -- | |
| Hill Dorothy | -- | First American Title |
Source: Public Records
Mortgage History
| Date | Status | Borrower | Loan Amount |
|---|---|---|---|
| Open | Lee Anwar | $73,800 | |
| Previous Owner | Nyahuma Jawanza O | $37,800 | |
| Previous Owner | Hill Dorothy | $36,400 |
Source: Public Records
Tax History Compared to Growth
Tax History
| Year | Tax Paid | Tax Assessment Tax Assessment Total Assessment is a certain percentage of the fair market value that is determined by local assessors to be the total taxable value of land and additions on the property. | Land | Improvement |
|---|---|---|---|---|
| 2025 | $442 | $5,130 | $440 | $4,690 |
| 2024 | $422 | $4,950 | $440 | $4,510 |
| 2023 | $422 | $4,950 | $440 | $4,510 |
| 2022 | $430 | $4,860 | $440 | $4,420 |
| 2021 | $429 | $4,860 | $440 | $4,420 |
| 2020 | $426 | $4,860 | $440 | $4,420 |
| 2019 | $425 | $4,870 | $440 | $4,430 |
| 2018 | $426 | $4,730 | $440 | $4,290 |
| 2017 | $419 | $4,730 | $440 | $4,290 |
| 2016 | $469 | $5,260 | $870 | $4,390 |
| 2015 | $427 | $5,260 | $870 | $4,390 |
| 2014 | $425 | $5,260 | $870 | $4,390 |
| 2013 | -- | $5,220 | $870 | $4,350 |
Source: Public Records
Map
Nearby Homes
- 4534 Margaretta Ave
- 4538 San Francisco Ave
- 3003 TAYOR N Taylor Ave
- 4629 Farlin Ave
- 3624 N Taylor Ave
- 4607 Lee Ave
- 4429 Farlin Ave
- 4707 Farlin Ave
- 4499 Lee Ave Unit B
- 4681 Kossuth Ave
- 4416 San Francisco Ave
- 4655 Lee Ave
- 4713-4715 Natural Bridge Ave
- 4823 San Francisco Ave
- 3526 Paris Ave
- 4477 Bessie Ave
- 3209 N Taylor Ave
- 4718 Lexington Ave
- 4246 N Taylor Ave
- 4669 Elmbank Ave
- 4542 Margaretta Ave
- 3934 Cora Ave
- 3926 Cora Ave
- 4538 Margaretta Ave
- 3924 Cora Ave
- 4530 Margaretta Ave
- 3916 Cora Ave
- 4000 Dryden Ave
- 4006 Dryden Ave
- 4612 Margaretta Ave
- 4545 San Francisco Ave
- 4541 San Francisco Ave
- 4001 N Taylor Ave
- 3915 Cora Ave
- 4601 San Francisco Ave
- 3917 Cora Ave
- 4520 San Francisco Ave
- 3923 Cora Ave
- 4008 Dryden Ave
- 3925 Cora Ave