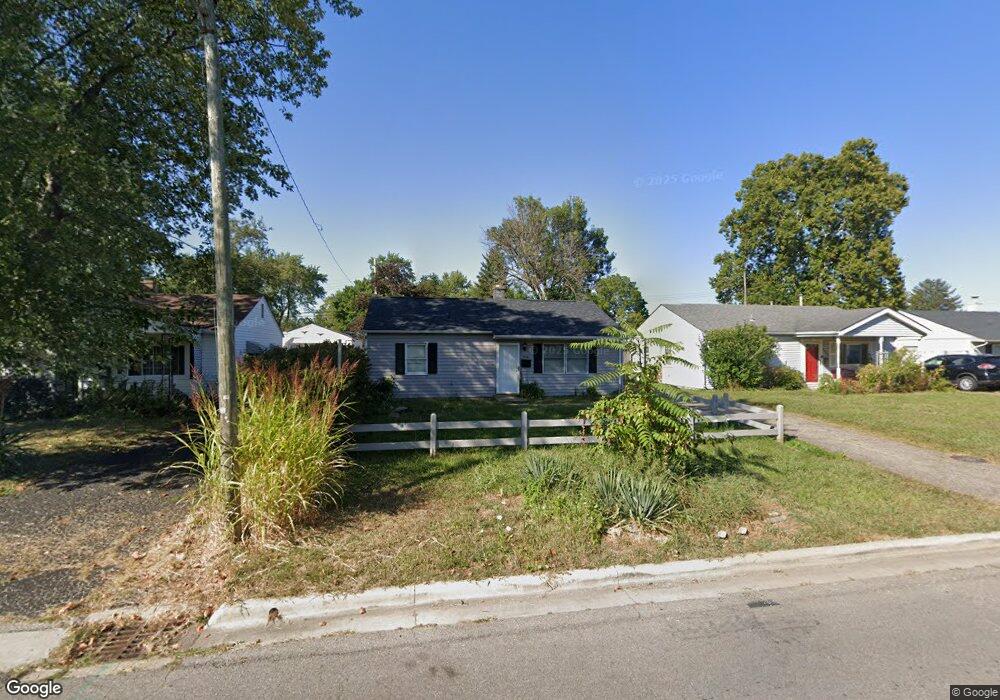
4546 San Jose Ln Columbus, OH 43213
Estimated Value: $197,733 - $237,000
3
Beds
1
Bath
1,084
Sq Ft
$193/Sq Ft
Est. Value
About This Home
This home is located at 4546 San Jose Ln, Columbus, OH 43213 and is currently estimated at $209,683, approximately $193 per square foot. 4546 San Jose Ln is a home located in Franklin County with nearby schools including Etna Road Elementary School, Beechwood Elementary School, and Rosemore Middle School.
Ownership History
Date
Name
Owned For
Owner Type
Purchase Details
Closed on
Feb 7, 2022
Sold by
Sheriff Of Franklin County
Bought by
Lbn Investments Llc
Current Estimated Value
Purchase Details
Closed on
Aug 19, 2005
Sold by
Jones Dale E and Jones Ted H
Bought by
Wade Terry L
Home Financials for this Owner
Home Financials are based on the most recent Mortgage that was taken out on this home.
Original Mortgage
$87,300
Interest Rate
8.45%
Mortgage Type
Fannie Mae Freddie Mac
Purchase Details
Closed on
Sep 7, 2001
Sold by
Bess Martin B and Bess Ann M
Bought by
Jones Dale E and Jones Ted H
Home Financials for this Owner
Home Financials are based on the most recent Mortgage that was taken out on this home.
Original Mortgage
$68,400
Interest Rate
7.06%
Mortgage Type
Purchase Money Mortgage
Purchase Details
Closed on
Feb 7, 1994
Bought by
Bess Martin B and Bess Ann M
Purchase Details
Closed on
Jul 20, 1990
Purchase Details
Closed on
Oct 17, 1989
Create a Home Valuation Report for This Property
The Home Valuation Report is an in-depth analysis detailing your home's value as well as a comparison with similar homes in the area
Home Values in the Area
Average Home Value in this Area
Purchase History
| Date | Buyer | Sale Price | Title Company |
|---|---|---|---|
| Lbn Investments Llc | $115,100 | Clunk Hoose Co Lpa | |
| Wade Terry L | $97,000 | -- | |
| Jones Dale E | $76,000 | -- | |
| Bess Martin B | -- | -- | |
| -- | -- | -- | |
| -- | $38,000 | -- |
Source: Public Records
Mortgage History
| Date | Status | Borrower | Loan Amount |
|---|---|---|---|
| Previous Owner | Wade Terry L | $87,300 | |
| Previous Owner | Jones Dale E | $68,400 |
Source: Public Records
Tax History Compared to Growth
Tax History
| Year | Tax Paid | Tax Assessment Tax Assessment Total Assessment is a certain percentage of the fair market value that is determined by local assessors to be the total taxable value of land and additions on the property. | Land | Improvement |
|---|---|---|---|---|
| 2024 | $2,338 | $52,220 | $13,370 | $38,850 |
| 2023 | $2,322 | $52,220 | $13,370 | $38,850 |
| 2022 | $1,498 | $23,560 | $5,150 | $18,410 |
| 2021 | $1,360 | $23,560 | $5,150 | $18,410 |
| 2020 | $1,527 | $23,560 | $5,150 | $18,410 |
| 2019 | $1,300 | $18,340 | $4,130 | $14,210 |
| 2018 | $1,140 | $18,340 | $4,130 | $14,210 |
| 2017 | $1,106 | $18,340 | $4,130 | $14,210 |
| 2016 | $1,129 | $17,290 | $4,200 | $13,090 |
| 2015 | $1,139 | $17,290 | $4,200 | $13,090 |
| 2014 | $1,139 | $17,290 | $4,200 | $13,090 |
| 2013 | $601 | $19,180 | $4,655 | $14,525 |
Source: Public Records
Map
Nearby Homes
- 4489 Saint Margaret Ln
- 451 Beaver Ave
- 353 Shell Ct E
- 4232 Mayflower Blvd
- 571 S Hamilton Rd
- 469 Cumberland Dr
- 424 Cumberland Dr
- 4148 Elbern Ave
- 579 Westphal Ave
- 4212 Seigman Ave
- 322 Fairway Cir
- 4780 Etna Rd Unit 782
- 4653 Kae Ave
- 547 Country Club Rd
- 4662 Jae Ave
- 91 Robinwood Ave
- 798 S Yearling Rd
- 110 Ironclad Dr Unit 9
- 185 Prairiecreek Way Unit 185
- 320 Collingwood Ave
- 4552 San Jose Ln
- 4538 San Jose Ln
- 4558 San Jose Ln
- 4532 San Jose Ln
- 4549 Saint Anthony Ln
- 4555 Saint Anthony Ln
- 4543 Saint Anthony Ln
- 4564 San Jose Ln
- 4563 Saint Anthony Ln
- 4526 San Jose Ln
- 4541 San Jose Ln
- 4535 San Jose Ln
- 4547 San Jose Ln
- 4569 Saint Anthony Ln
- 4529 Saint Anthony Ln
- 4570 San Jose Ln
- 4553 San Jose Ln
- 4529 San Jose Ln
- 4520 San Jose Ln