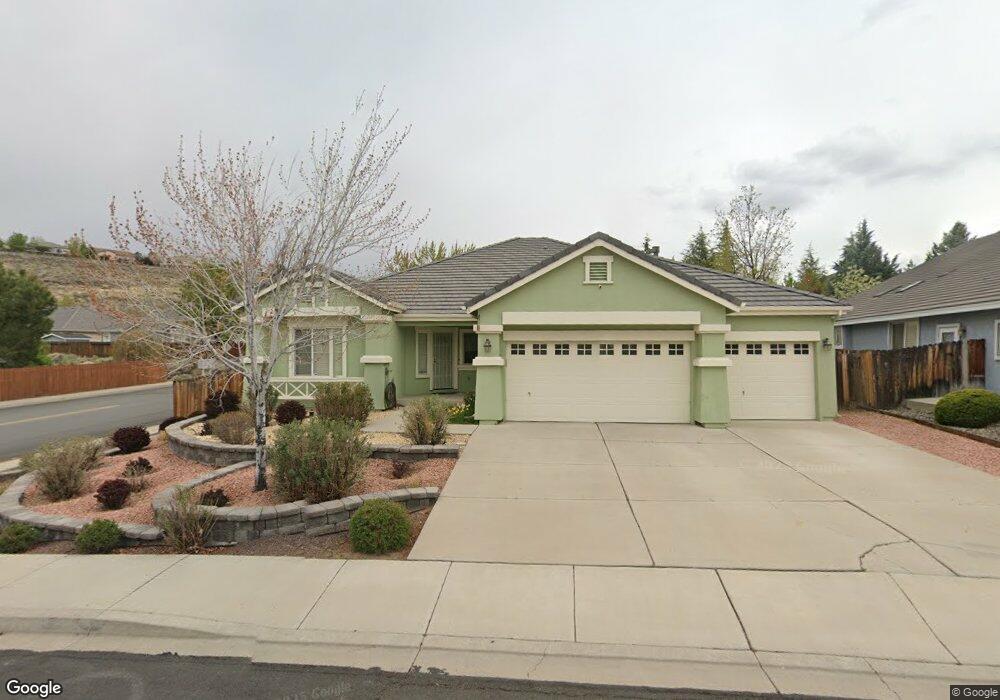
4548 Goodwin Rd Sparks, NV 89436
Los Altos Parkway NeighborhoodEstimated Value: $651,000 - $672,000
4
Beds
3
Baths
2,386
Sq Ft
$277/Sq Ft
Est. Value
About This Home
This home is located at 4548 Goodwin Rd, Sparks, NV 89436 and is currently estimated at $660,602, approximately $276 per square foot. 4548 Goodwin Rd is a home located in Washoe County with nearby schools including Bud Beasley Elementary School, Lou Mendive Middle School, and Edward C Reed High School.
Ownership History
Date
Name
Owned For
Owner Type
Purchase Details
Closed on
Mar 19, 2004
Sold by
Sorensen Donald R
Bought by
Powell James R and Powell Toni L
Current Estimated Value
Home Financials for this Owner
Home Financials are based on the most recent Mortgage that was taken out on this home.
Original Mortgage
$295,000
Outstanding Balance
$137,580
Interest Rate
5.64%
Mortgage Type
Unknown
Estimated Equity
$523,022
Purchase Details
Closed on
Jul 30, 2002
Sold by
Barker Coleman Communities Llc
Bought by
Sorensen Donald R
Home Financials for this Owner
Home Financials are based on the most recent Mortgage that was taken out on this home.
Original Mortgage
$256,500
Interest Rate
6.7%
Purchase Details
Closed on
Jul 26, 2002
Sold by
Sorensen Ursula G
Bought by
Sorensen Donald R
Home Financials for this Owner
Home Financials are based on the most recent Mortgage that was taken out on this home.
Original Mortgage
$256,500
Interest Rate
6.7%
Create a Home Valuation Report for This Property
The Home Valuation Report is an in-depth analysis detailing your home's value as well as a comparison with similar homes in the area
Home Values in the Area
Average Home Value in this Area
Purchase History
| Date | Buyer | Sale Price | Title Company |
|---|---|---|---|
| Powell James R | $335,000 | Western Title Incorporated | |
| Sorensen Donald R | $285,000 | Stewart Title Northern Nevad | |
| Sorensen Donald R | $285,000 | Stewart Title Northern Nevad |
Source: Public Records
Mortgage History
| Date | Status | Borrower | Loan Amount |
|---|---|---|---|
| Open | Powell James R | $295,000 | |
| Previous Owner | Sorensen Donald R | $256,500 |
Source: Public Records
Tax History Compared to Growth
Tax History
| Year | Tax Paid | Tax Assessment Tax Assessment Total Assessment is a certain percentage of the fair market value that is determined by local assessors to be the total taxable value of land and additions on the property. | Land | Improvement |
|---|---|---|---|---|
| 2025 | $3,305 | $155,594 | $43,120 | $112,474 |
| 2024 | $3,210 | $150,987 | $37,555 | $113,432 |
| 2023 | $3,210 | $147,720 | $40,180 | $107,540 |
| 2022 | $3,117 | $122,378 | $32,865 | $89,513 |
| 2021 | $3,026 | $117,064 | $28,035 | $89,029 |
| 2020 | $2,936 | $116,647 | $27,405 | $89,242 |
| 2019 | $2,851 | $113,402 | $26,600 | $86,802 |
| 2018 | $2,769 | $104,542 | $19,740 | $84,802 |
| 2017 | $2,690 | $104,654 | $19,740 | $84,914 |
| 2016 | $2,619 | $105,944 | $19,390 | $86,554 |
| 2015 | $2,614 | $94,480 | $15,855 | $78,625 |
| 2014 | $2,539 | $87,471 | $13,860 | $73,611 |
| 2013 | -- | $67,591 | $10,640 | $56,951 |
Source: Public Records
Map
Nearby Homes
- 1850 Almonte Ct
- 4383 Setting Sun Ct Unit 1
- 4393 Acobat Ct
- 4675 Firtree Ln
- 4601 N Cactus Hills Ct
- 1685 Southview Dr
- 1550 Istrice Rd
- 1484 Serendipity Ct
- 1560 Freeman Way
- 1557 Satellite Dr
- 2411 Tecumseh Way Unit 12
- 2415 Tecumseh Way
- 2427 Tecumseh Way Unit 8
- 1475 Golddust Dr
- 2316 Isabella Ct
- 3324 Danville Dr
- 2738 Kettle Ct
- 1716 Canyon Terrace Dr
- 1357 Silver View Cir
- 3221 Myles Dr
- 4546 Goodwin Rd
- 4391 Talladega Dr
- 4550 Goodwin Rd
- 4542 Goodwin Rd
- 4381 Talladega Dr
- 4547 Goodwin Rd
- 4549 Goodwin Rd
- 4545 Goodwin Rd
- 4554 Goodwin Rd
- 4540 Goodwin Rd
- 4371 Talladega Dr
- 4551 Goodwin Rd
- 4541 Goodwin Rd
- 1860 Almonte Ct
- 4556 Goodwin Rd
- 1780 Braidwood Dr
- 2265-2320 Lakota Ct Unit 1-8
- 2265-2320 Lakota Ct
- 4536 Goodwin Rd
- 4539 Goodwin Rd