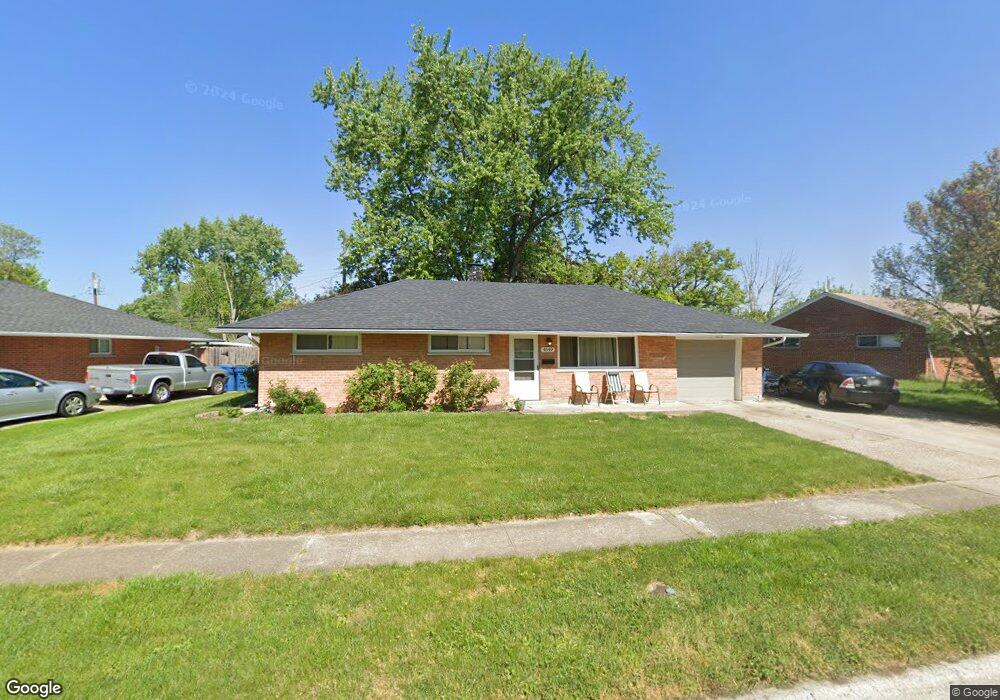
4549 Korner Dr Dayton, OH 45424
Estimated Value: $176,000 - $195,000
3
Beds
2
Baths
1,080
Sq Ft
$173/Sq Ft
Est. Value
About This Home
This home is located at 4549 Korner Dr, Dayton, OH 45424 and is currently estimated at $187,027, approximately $173 per square foot. 4549 Korner Dr is a home located in Montgomery County with nearby schools including Wayne High School and Pathway School of Discovery.
Ownership History
Date
Name
Owned For
Owner Type
Purchase Details
Closed on
May 9, 2019
Sold by
M Brittany Success Ltd
Bought by
Garrett Timothy L
Current Estimated Value
Home Financials for this Owner
Home Financials are based on the most recent Mortgage that was taken out on this home.
Original Mortgage
$109,198
Outstanding Balance
$95,209
Interest Rate
4.1%
Mortgage Type
VA
Estimated Equity
$91,818
Purchase Details
Closed on
Apr 26, 2017
Sold by
Wilson Diane
Bought by
M Brittany Success Ltd
Purchase Details
Closed on
May 2, 2002
Sold by
David Blagg R and David Cynthia A
Bought by
Wilson Diane and Daugherty Steve R
Home Financials for this Owner
Home Financials are based on the most recent Mortgage that was taken out on this home.
Original Mortgage
$81,458
Interest Rate
7.24%
Mortgage Type
FHA
Purchase Details
Closed on
Nov 9, 1994
Sold by
Mcfarland Mathew L and Mcfarland Judy A
Bought by
Blagg R David and Blagg Cynthia A
Create a Home Valuation Report for This Property
The Home Valuation Report is an in-depth analysis detailing your home's value as well as a comparison with similar homes in the area
Home Values in the Area
Average Home Value in this Area
Purchase History
| Date | Buyer | Sale Price | Title Company |
|---|---|---|---|
| Garrett Timothy L | $106,900 | Republic Title Agency Inc | |
| M Brittany Success Ltd | $42,100 | None Available | |
| Wilson Diane | $82,000 | -- | |
| Blagg R David | -- | -- |
Source: Public Records
Mortgage History
| Date | Status | Borrower | Loan Amount |
|---|---|---|---|
| Open | Garrett Timothy L | $109,198 | |
| Previous Owner | Wilson Diane | $81,458 |
Source: Public Records
Tax History
| Year | Tax Paid | Tax Assessment Tax Assessment Total Assessment is a certain percentage of the fair market value that is determined by local assessors to be the total taxable value of land and additions on the property. | Land | Improvement |
|---|---|---|---|---|
| 2025 | $2,540 | $46,400 | $10,010 | $36,390 |
| 2024 | $2,456 | $46,400 | $10,010 | $36,390 |
| 2023 | $2,456 | $46,400 | $10,010 | $36,390 |
| 2022 | $2,178 | $32,420 | $7,000 | $25,420 |
| 2021 | $2,208 | $32,420 | $7,000 | $25,420 |
| 2020 | $2,210 | $32,420 | $7,000 | $25,420 |
| 2019 | $1,381 | $17,690 | $7,000 | $10,690 |
| 2018 | $1,385 | $17,690 | $7,000 | $10,690 |
| 2017 | $1,432 | $17,690 | $7,000 | $10,690 |
| 2016 | $1,576 | $20,370 | $7,000 | $13,370 |
| 2015 | $1,556 | $20,370 | $7,000 | $13,370 |
| 2014 | $1,556 | $20,370 | $7,000 | $13,370 |
| 2012 | -- | $24,600 | $8,750 | $15,850 |
Source: Public Records
Map
Nearby Homes
- 4642 Kautz Dr
- 5100 Pocono Dr
- 4813 Nebraska Ave
- 5062 Nielson Ct
- 5422 Pitcairn Rd
- 5216 Lemoyne Dr
- 5669 Traymore Dr
- 4612 Passaic Ct
- 4536 Powell Rd
- 6642 Renfield Dr
- 5030 Renard Dr
- 4103 Hemlock Ct
- 4750 Whitewood Ct
- 4214 Pheasant Ct Unit 4214
- 5662 Brandt Pike
- 4739 Strathaven Dr
- 4119 Vitek Dr Unit 4119
- 4095 Vitek Dr Unit 4297
- 4105 Vitek Dr Unit 4105
- 4130 Beech Tree Ct
Your Personal Tour Guide
Ask me questions while you tour the home.