Estimated Value: $472,753 - $499,000
4
Beds
3
Baths
3,740
Sq Ft
$130/Sq Ft
Est. Value
About This Home
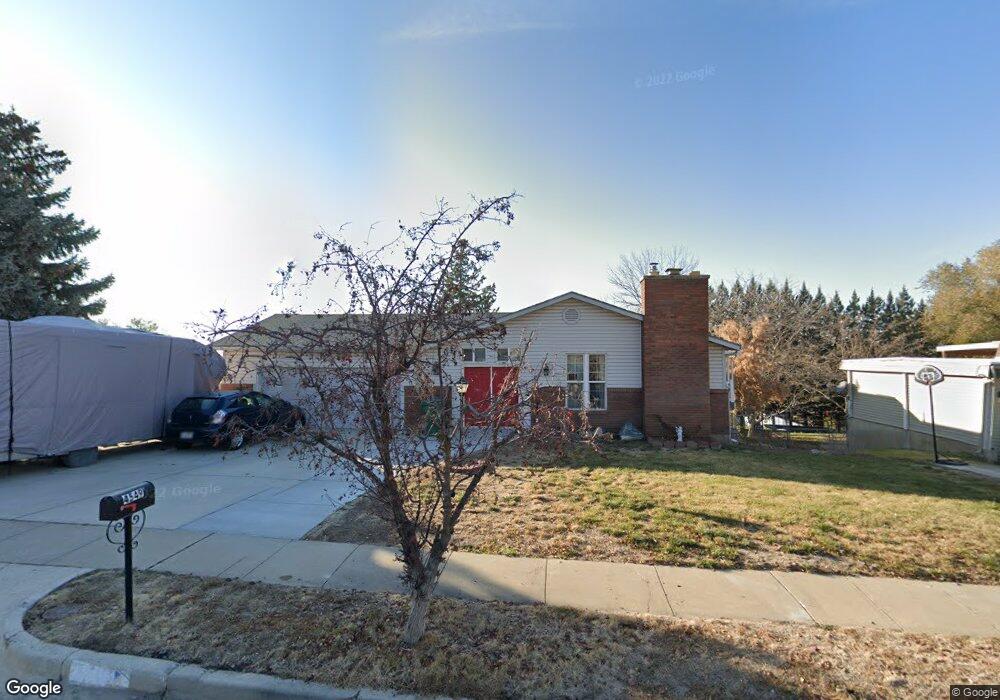
This home is located at 4549 S 2600 W, Roy, UT 84067 and is currently estimated at $484,938, approximately $129 per square foot. 4549 S 2600 W is a home located in Weber County with nearby schools including Valley View School, Sand Ridge Junior High School, and Roy High School.
Ownership History
Date
Name
Owned For
Owner Type
Purchase Details
Closed on
Sep 18, 2013
Sold by
Williams Jeffrey A and Williams Julie A
Bought by
Williams Julie A
Current Estimated Value
Home Financials for this Owner
Home Financials are based on the most recent Mortgage that was taken out on this home.
Original Mortgage
$95,400
Outstanding Balance
$23,163
Interest Rate
3.41%
Mortgage Type
New Conventional
Estimated Equity
$461,775
Purchase Details
Closed on
Nov 5, 2001
Sold by
Carrillo Jesse and Carrillo Julia M
Bought by
Williams Jeffrey A and Williams Julie A
Home Financials for this Owner
Home Financials are based on the most recent Mortgage that was taken out on this home.
Original Mortgage
$147,290
Interest Rate
6.84%
Mortgage Type
VA
Create a Home Valuation Report for This Property
The Home Valuation Report is an in-depth analysis detailing your home's value as well as a comparison with similar homes in the area
Home Values in the Area
Average Home Value in this Area
Purchase History
| Date | Buyer | Sale Price | Title Company |
|---|---|---|---|
| Williams Julie A | -- | First American Layton | |
| Williams Jeffrey A | -- | Equity Title |
Source: Public Records
Mortgage History
| Date | Status | Borrower | Loan Amount |
|---|---|---|---|
| Open | Williams Julie A | $95,400 | |
| Closed | Williams Jeffrey A | $147,290 |
Source: Public Records
Tax History Compared to Growth
Tax History
| Year | Tax Paid | Tax Assessment Tax Assessment Total Assessment is a certain percentage of the fair market value that is determined by local assessors to be the total taxable value of land and additions on the property. | Land | Improvement |
|---|---|---|---|---|
| 2025 | $3,190 | $514,715 | $116,398 | $398,317 |
| 2024 | $3,108 | $277,749 | $64,018 | $213,731 |
| 2023 | $3,027 | $271,150 | $62,137 | $209,013 |
| 2022 | $3,010 | $276,650 | $56,725 | $219,925 |
| 2021 | $2,458 | $371,000 | $72,748 | $298,252 |
| 2020 | $2,336 | $324,000 | $72,748 | $251,252 |
| 2019 | $2,238 | $292,000 | $42,353 | $249,647 |
| 2018 | $2,237 | $276,000 | $40,192 | $235,808 |
| 2017 | $1,929 | $221,000 | $37,151 | $183,849 |
| 2016 | $1,886 | $116,368 | $19,649 | $96,719 |
| 2015 | $1,718 | $108,245 | $19,649 | $88,596 |
| 2014 | $1,733 | $108,245 | $19,649 | $88,596 |
Source: Public Records
Map
Nearby Homes
- 2642 W 4400 S
- 1952 W 5450 S
- 4670 S 2525 W
- 2816 W 4400 S
- 2802 W 4375 S
- 4875 S 2675 W
- 2259 W 4525 S
- 4635 S 2950 W
- 2263 W 4400 S
- 2411 W 4900 S
- 4919 S 2675 W
- 2835 W 4200 S
- 3014 W 4750 S
- 4118 Westlake Dr
- 2777 W 4175 S Unit 229
- 2778 W 4175 S Unit 235
- 4891 S 2875 W
- 5007 S 2675 W
- 5024 S 2575 W
- 2153 W 4800 S