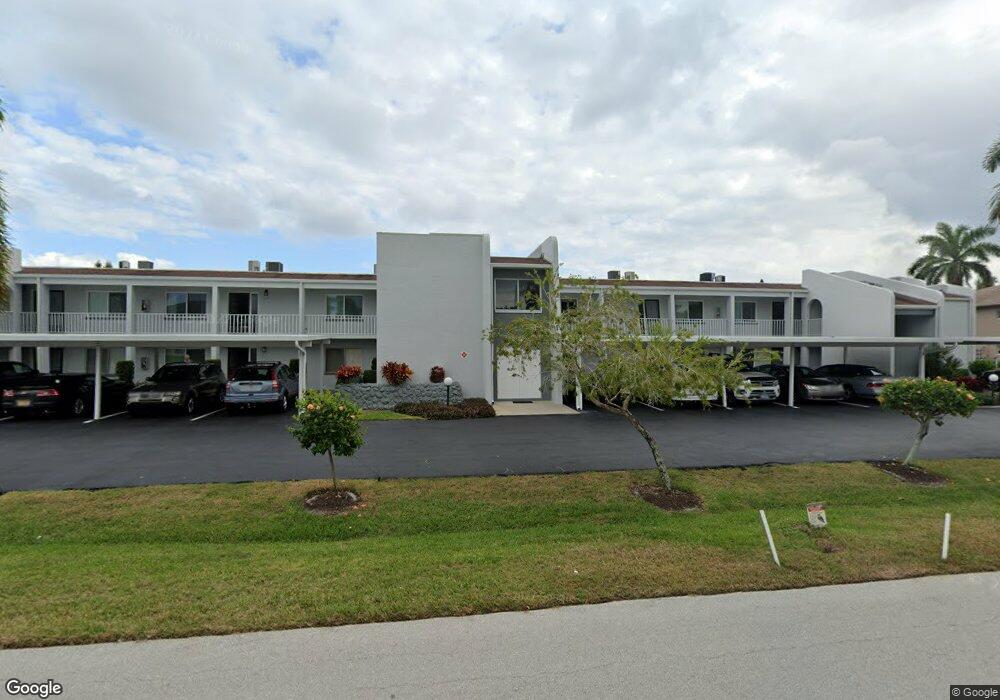
4549 SE 5th Place Unit 110 Cape Coral, FL 33904
Caloosahatchee NeighborhoodEstimated Value: $188,348 - $231,000
2
Beds
2
Baths
1,019
Sq Ft
$202/Sq Ft
Est. Value
About This Home
This home is located at 4549 SE 5th Place Unit 110, Cape Coral, FL 33904 and is currently estimated at $206,337, approximately $202 per square foot. 4549 SE 5th Place Unit 110 is a home located in Lee County with nearby schools including Cape Elementary School, Caloosa Elementary School, and Hancock Creek Elementary School.
Ownership History
Date
Name
Owned For
Owner Type
Purchase Details
Closed on
Mar 24, 2017
Sold by
Natella Alfred and Belisle Eric
Bought by
Henderson Martin A
Current Estimated Value
Purchase Details
Closed on
Feb 11, 2005
Sold by
Knutson Leonard
Bought by
Natella Alfred and Belisle Eric
Home Financials for this Owner
Home Financials are based on the most recent Mortgage that was taken out on this home.
Original Mortgage
$124,800
Interest Rate
5.75%
Mortgage Type
Credit Line Revolving
Purchase Details
Closed on
Apr 10, 2002
Sold by
Wilson Harold A and Wilson Margaret L
Bought by
Knutson Leonard
Home Financials for this Owner
Home Financials are based on the most recent Mortgage that was taken out on this home.
Original Mortgage
$42,000
Interest Rate
6.89%
Create a Home Valuation Report for This Property
The Home Valuation Report is an in-depth analysis detailing your home's value as well as a comparison with similar homes in the area
Home Values in the Area
Average Home Value in this Area
Purchase History
| Date | Buyer | Sale Price | Title Company |
|---|---|---|---|
| Henderson Martin A | $129,900 | Warranty Title Solution Llc | |
| Natella Alfred | $158,000 | Bay Title Services | |
| Knutson Leonard | -- | -- | |
| Knutson Leonard | $93,000 | -- |
Source: Public Records
Mortgage History
| Date | Status | Borrower | Loan Amount |
|---|---|---|---|
| Previous Owner | Natella Alfred | $124,800 | |
| Previous Owner | Knutson Leonard | $42,000 |
Source: Public Records
Tax History Compared to Growth
Tax History
| Year | Tax Paid | Tax Assessment Tax Assessment Total Assessment is a certain percentage of the fair market value that is determined by local assessors to be the total taxable value of land and additions on the property. | Land | Improvement |
|---|---|---|---|---|
| 2025 | $1,459 | $105,879 | -- | -- |
| 2024 | $1,395 | $102,895 | -- | -- |
| 2023 | $1,395 | $99,898 | $0 | $0 |
| 2022 | $1,245 | $96,988 | $0 | $0 |
| 2021 | $1,220 | $116,963 | $0 | $116,963 |
| 2020 | $1,208 | $92,863 | $0 | $92,863 |
| 2019 | $1,215 | $93,670 | $0 | $93,670 |
| 2018 | $1,231 | $93,670 | $0 | $93,670 |
| 2017 | $1,916 | $96,900 | $0 | $96,900 |
| 2016 | $1,761 | $86,055 | $0 | $86,055 |
| 2015 | $1,623 | $75,300 | $0 | $75,300 |
| 2014 | $1,502 | $71,500 | $0 | $71,500 |
| 2013 | -- | $61,700 | $0 | $61,700 |
Source: Public Records
Map
Nearby Homes
- 4549 SE 5th Place Unit 211
- 4550 SE 5th Place Unit 202
- 4563 SE 5th Place Unit 205
- 4541 SE 5th Place Unit 207
- 4538 SE 5th Place Unit 3
- 4611 SE 5th Place Unit 8
- 4521 SE 5th Place
- 4608 SE 6th Ave Unit 1D
- 4610 SE 5th Place Unit 302
- 4610 SE 5th Place Unit 201
- 4525 Country Club Blvd Unit 110
- 4515 Country Club Blvd Unit 103
- 4515 Country Club Blvd Unit 204
- 4417 Country Club Blvd Unit B6
- 4411 Country Club Blvd Unit A2
- 4411 Country Club Blvd Unit A1
- 4616 SE 6th Ave Unit 104
- 4629 SE 5th Place Unit 12
- 4507 SE 5th Place
- 4500 SE 5th Place Unit 105
- 4549 SE 5th Place Unit 115
- 4549 SE 5th Place Unit 213
- 4549 SE 5th Place Unit 209
- 4549 SE 5th Place Unit 113
- 4549 SE 5th Place Unit 216
- 4549 SE 5th Place Unit 112
- 4549 SE 5th Place Unit 214
- 4549 SE 5th Place Unit 210
- 4549 SE 5th Place Unit 212
- 4549 SE 5th Place Unit 114
- 4549 SE 5th Place Unit 215
- 4549 SE 5th Place Unit 116
- 4549 SE 5th Place Unit 111
- 4532/4534 SE 6th Place
- 4550 SE 5th Place Unit 201
- 4550 SE 5th Place Unit 101
- 4550 SE 5th Place Unit 103
- 4550 SE 5th Place Unit 102
- 4550 SE 5th Place Unit 203
- 4561 SE 5th Place Unit 103