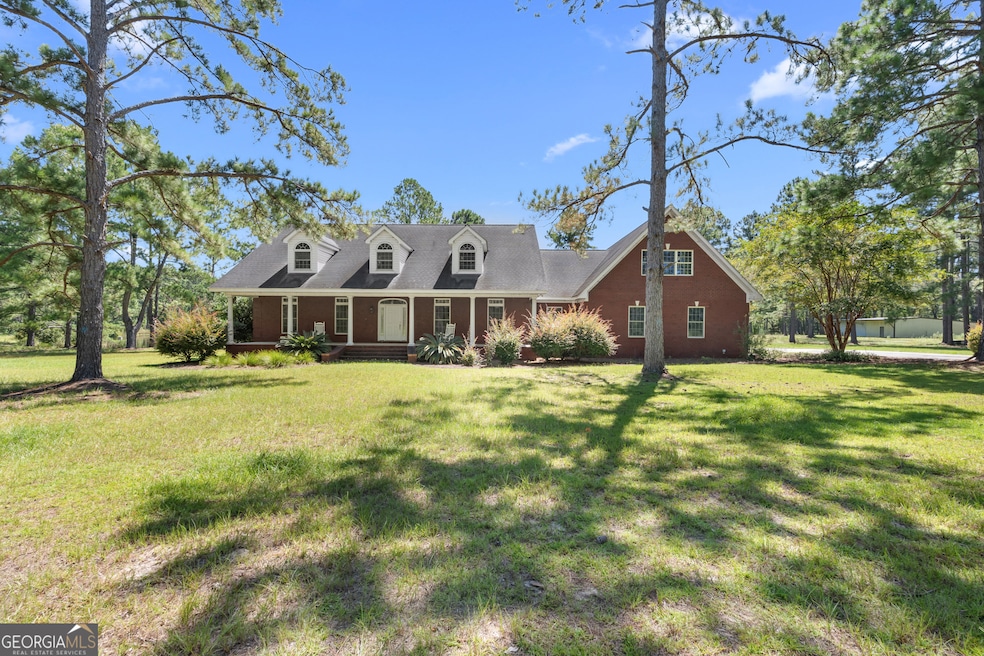
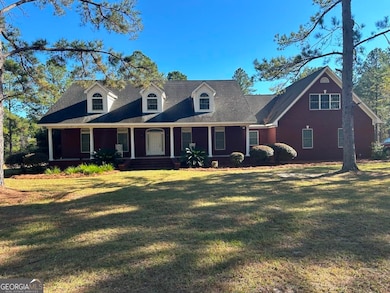
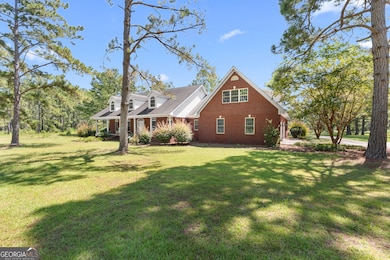
455 Best Bridge Rd Sylvania, GA 30467
Estimated payment $6,250/month
About This Lot
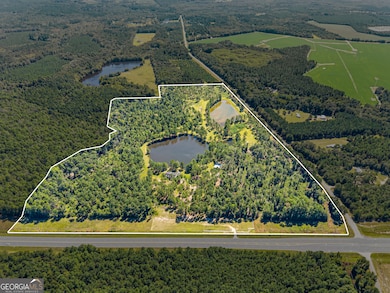
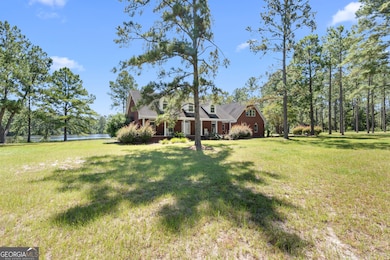
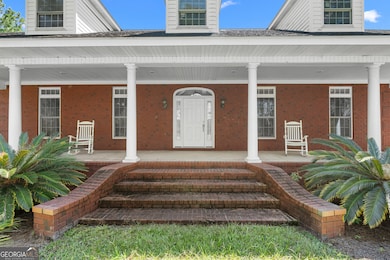
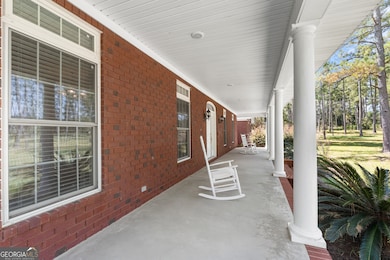
Beautiful 67 acre parcel at the intersection of Hwy 301 and Best Bridge Road just South of Sylvania GA. The 3500 square foot home has high end finishes throughout. The main floor has 3 beds and 2.5 baths with a large master suite, open floor plan in the living room and kitchen. There is also a formal dining room and large laundry room. The home also has 720 square feet of living area upstairs partially finished. Just out the back of the house is the 1st pond and a 50 x 60 shop. The lower section of the property has a second pond with a creek and large timber making hunting, fishing and enjoying the outdoors readily available. Call to see this great property today.
Listing Agent
Plantation Properties & Land Invest License #372051 Listed on: 12/02/2024
Property Details
Property Type
- Land
Est. Annual Taxes
- $5,419
Lot Details
- 67.1 Acre Lot
Schools
- Screven County Elementary And Middle School
- Screven County High School
Utilities
- Private Water Source
- Septic Tank
Community Details
- No Home Owners Association
Map
Home Values in the Area
Average Home Value in this Area
Tax History
| Year | Tax Paid | Tax Assessment Tax Assessment Total Assessment is a certain percentage of the fair market value that is determined by local assessors to be the total taxable value of land and additions on the property. | Land | Improvement |
|---|---|---|---|---|
| 2024 | $5,569 | $200,040 | $86,120 | $113,920 |
| 2023 | $5,569 | $200,040 | $86,120 | $113,920 |
| 2022 | $4,996 | $173,680 | $77,160 | $96,520 |
| 2021 | $4,226 | $146,480 | $59,160 | $87,320 |
| 2020 | $3,011 | $140,160 | $55,200 | $84,960 |
| 2019 | $3,060 | $142,320 | $55,200 | $87,120 |
| 2018 | $4,091 | $142,880 | $54,400 | $88,480 |
| 2017 | $4,091 | $142,880 | $54,400 | $88,480 |
| 2016 | $2,957 | $186,160 | $95,560 | $90,600 |
| 2015 | -- | $184,280 | $94,760 | $89,520 |
| 2014 | -- | $184,160 | $94,760 | $89,400 |
| 2013 | -- | $186,160 | $94,760 | $91,400 |
Property History
| Date | Event | Price | List to Sale | Price per Sq Ft |
|---|---|---|---|---|
| 10/31/2025 10/31/25 | Pending | -- | -- | -- |
| 12/31/2024 12/31/24 | For Sale | $1,100,000 | 0.0% | -- |
| 12/12/2024 12/12/24 | Pending | -- | -- | -- |
| 12/02/2024 12/02/24 | For Sale | $1,100,000 | -- | -- |
Purchase History
| Date | Type | Sale Price | Title Company |
|---|---|---|---|
| Deed | $57,600 | -- |
Source: Georgia MLS
MLS Number: 10421025
APN: 067-004
Disclaimer: Certain information contained herein is derived from information provided by parties other than Homes.com. All information provided is deemed reliable, but is not guaranteed to be accurate and should be independently verified.
![]() The data relating to real estate for sale on this web site comes in part from the Broker Reciprocity Program of Georgia MLS. Real estate listings held by brokerage firms other than Redfin are marked with the Broker Reciprocity logo and detailed information about them includes the name of the listing brokers. Information deemed reliable but not guaranteed. Copyright 2025 Georgia MLS. All rights reserved.
The data relating to real estate for sale on this web site comes in part from the Broker Reciprocity Program of Georgia MLS. Real estate listings held by brokerage firms other than Redfin are marked with the Broker Reciprocity logo and detailed information about them includes the name of the listing brokers. Information deemed reliable but not guaranteed. Copyright 2025 Georgia MLS. All rights reserved.
- 480 Best Bridge Rd
- 0 Best Bridge Rd Unit 10585900
- 0 Best Bridge Rd Unit SA336787
- 372 Pye Rd
- 0 S Fork Rd
- 596 Arnett School Rd
- 103 Live Oak Rd
- 711 Scrub Oak Rd
- 736 Arnett School Rd
- 0 Honey Rd Unit 10510039
- 184 Sawgrass Rd
- 0 Halcyondale Rd Unit SA331612
- 0 Halcyondale Rd Unit 10536056
- 731 Deer Run Rd
- 611 W Ogeechee St
- 112 Cail St
- 208 Wildwood Dr
- 1161 Savannah Hwy
- 814 S Main St
- 104 Wildwood St
