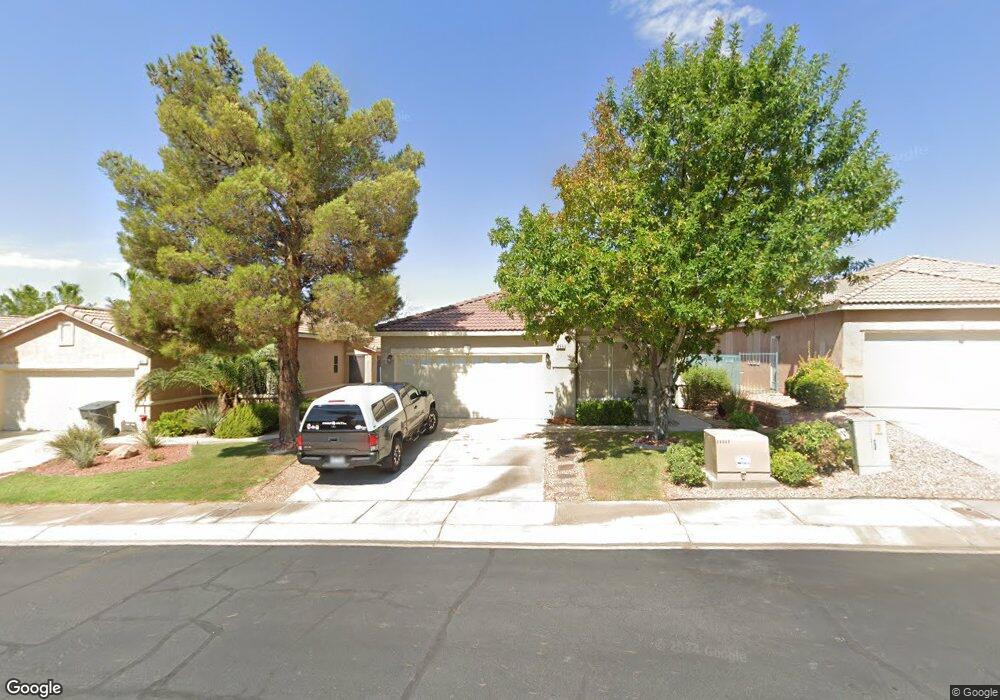
455 Canyon View Way Mesquite, NV 89027
Estimated Value: $362,188 - $378,000
3
Beds
2
Baths
1,636
Sq Ft
$225/Sq Ft
Est. Value
About This Home
This home is located at 455 Canyon View Way, Mesquite, NV 89027 and is currently estimated at $368,797, approximately $225 per square foot. 455 Canyon View Way is a home located in Clark County with nearby schools including Virgin Valley Elementary School, Charles Arthur Hughes Middle School, and Virgin Valley High School.
Ownership History
Date
Name
Owned For
Owner Type
Purchase Details
Closed on
Oct 3, 2017
Sold by
Howard Timothy R and Howard Jane A
Bought by
Howard Timothy R and Howard Jane A
Current Estimated Value
Purchase Details
Closed on
Feb 17, 2017
Sold by
Bradford David A and Bradford Deborah A
Bought by
Howard Timothy R and Howard Jane A
Purchase Details
Closed on
May 16, 2012
Sold by
Johnson Ronald E and Johnson Eleanor J
Bought by
Bradford David A and Bradford Deborah A
Home Financials for this Owner
Home Financials are based on the most recent Mortgage that was taken out on this home.
Original Mortgage
$87,500
Interest Rate
3.86%
Mortgage Type
New Conventional
Purchase Details
Closed on
Sep 25, 2001
Sold by
Sedona At Mesquite Llc
Bought by
Johnson Ronald E and Johnson Eleanor J
Create a Home Valuation Report for This Property
The Home Valuation Report is an in-depth analysis detailing your home's value as well as a comparison with similar homes in the area
Home Values in the Area
Average Home Value in this Area
Purchase History
| Date | Buyer | Sale Price | Title Company |
|---|---|---|---|
| Howard Timothy R | -- | None Available | |
| Howard Timothy R | $199,900 | Fidelity National Title Agen | |
| Bradford David A | $157,000 | Fidelity Title Mesquite | |
| Johnson Ronald E | $138,980 | First American Title Co |
Source: Public Records
Mortgage History
| Date | Status | Borrower | Loan Amount |
|---|---|---|---|
| Previous Owner | Bradford David A | $87,500 |
Source: Public Records
Tax History Compared to Growth
Tax History
| Year | Tax Paid | Tax Assessment Tax Assessment Total Assessment is a certain percentage of the fair market value that is determined by local assessors to be the total taxable value of land and additions on the property. | Land | Improvement |
|---|---|---|---|---|
| 2025 | $1,784 | $94,729 | $27,650 | $67,079 |
| 2024 | $1,733 | $94,729 | $27,650 | $67,079 |
| 2023 | $1,733 | $88,469 | $24,850 | $63,619 |
| 2022 | $1,683 | $80,837 | $22,750 | $58,087 |
| 2021 | $1,634 | $76,193 | $21,000 | $55,193 |
| 2020 | $1,584 | $74,351 | $19,600 | $54,751 |
| 2019 | $1,538 | $71,031 | $17,150 | $53,881 |
| 2018 | $1,494 | $65,197 | $13,300 | $51,897 |
| 2017 | $1,700 | $61,299 | $11,900 | $49,399 |
| 2016 | $1,341 | $55,055 | $9,800 | $45,255 |
| 2015 | $1,339 | $50,175 | $8,750 | $41,425 |
| 2014 | $1,297 | $51,939 | $8,750 | $43,189 |
Source: Public Records
Map
Nearby Homes
- 465 Turtleback Rd Unit B
- 555 Highland Dr Unit 330
- 517 W Mesquite Blvd
- 697 Cinco Ct
- 744 Pinnacle Ct
- 870 Ironwood Dr
- 162 Hermosa Way
- 228 Hiawatha Way
- 957 Diamond Cir
- 262 Thistle St
- 777 2nd St S
- 581 Emperor Ln Unit 1
- 601 Hillside Dr
- 254 Reber Dr
- 271 Concord Dr
- 844 Glendale Rd
- 844 Sagedell Rd
- 890 Kitty Hawk Dr Unit 2523
- 704 Appletree Ln
- 1180 Mesa Verde Run
- 459 Canyon View Way
- 451 Canyon View Way
- 463 Canyon View Way
- 447 Canyon View Way
- 454 Canyon Dr
- 458 Canyon Dr
- 467 Canyon View Way
- 443 Canyon View Way
- 462 Canyon Dr
- 450 Canyon Dr
- 452 Canyon View Way
- 448 Canyon View Way
- 456 Canyon View Way
- 466 Canyon Dr
- 444 Canyon View Way
- 471 Canyon View Way
- 460 Canyon View Way
- 446 Canyon Dr
- 439 Canyon View Way
- 470 Canyon Dr