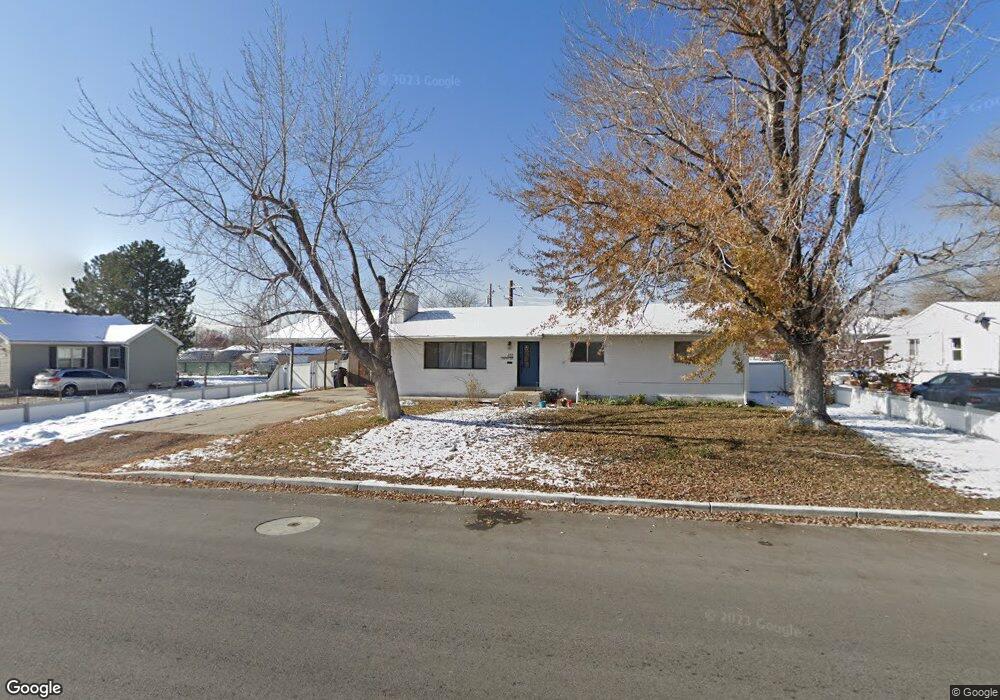
455 Caveman Dr American Fork, UT 84003
Estimated Value: $506,000 - $530,000
6
Beds
2
Baths
2,496
Sq Ft
$208/Sq Ft
Est. Value
About This Home
This home is located at 455 Caveman Dr, American Fork, UT 84003 and is currently estimated at $518,943, approximately $207 per square foot. 455 Caveman Dr is a home located in Utah County with nearby schools including Forbes Elementary School, American Fork Junior High School, and American Fork High School.
Ownership History
Date
Name
Owned For
Owner Type
Purchase Details
Closed on
Aug 11, 2021
Sold by
Wall Scott and Wall Alex
Bought by
Wall Alexandria and Wall Scott Charles
Current Estimated Value
Home Financials for this Owner
Home Financials are based on the most recent Mortgage that was taken out on this home.
Original Mortgage
$160,000
Outstanding Balance
$145,490
Interest Rate
2.9%
Mortgage Type
New Conventional
Estimated Equity
$373,453
Purchase Details
Closed on
Jul 31, 2013
Sold by
Ashenbrener Toni and Anne P Maddox Trust
Bought by
Wall Scott and Wall Alex
Purchase Details
Closed on
Oct 31, 2007
Sold by
Maddox Anne Phelps and Maddox Anne P
Bought by
Maddox Anne P and Anne P Maddox Trust
Create a Home Valuation Report for This Property
The Home Valuation Report is an in-depth analysis detailing your home's value as well as a comparison with similar homes in the area
Home Values in the Area
Average Home Value in this Area
Purchase History
| Date | Buyer | Sale Price | Title Company |
|---|---|---|---|
| Wall Alexandria | -- | Capstone T&E Inc | |
| Wall Scott | -- | Atlas Title | |
| Maddox Anne P | -- | None Available |
Source: Public Records
Mortgage History
| Date | Status | Borrower | Loan Amount |
|---|---|---|---|
| Open | Wall Alexandria | $160,000 |
Source: Public Records
Tax History Compared to Growth
Tax History
| Year | Tax Paid | Tax Assessment Tax Assessment Total Assessment is a certain percentage of the fair market value that is determined by local assessors to be the total taxable value of land and additions on the property. | Land | Improvement |
|---|---|---|---|---|
| 2025 | $2,082 | $248,490 | $211,000 | $240,800 |
| 2024 | $2,082 | $231,330 | $0 | $0 |
| 2023 | $1,927 | $227,040 | $0 | $0 |
| 2022 | $2,182 | $253,660 | $0 | $0 |
| 2021 | $1,866 | $338,800 | $151,500 | $187,300 |
| 2020 | $1,744 | $307,100 | $135,300 | $171,800 |
| 2019 | $1,634 | $297,700 | $127,500 | $170,200 |
| 2018 | $1,515 | $263,900 | $115,900 | $148,000 |
| 2017 | $1,463 | $137,500 | $0 | $0 |
| 2016 | $1,377 | $120,285 | $0 | $0 |
| 2015 | $1,396 | $115,720 | $0 | $0 |
| 2014 | $1,292 | $105,655 | $0 | $0 |
Source: Public Records
Map
Nearby Homes