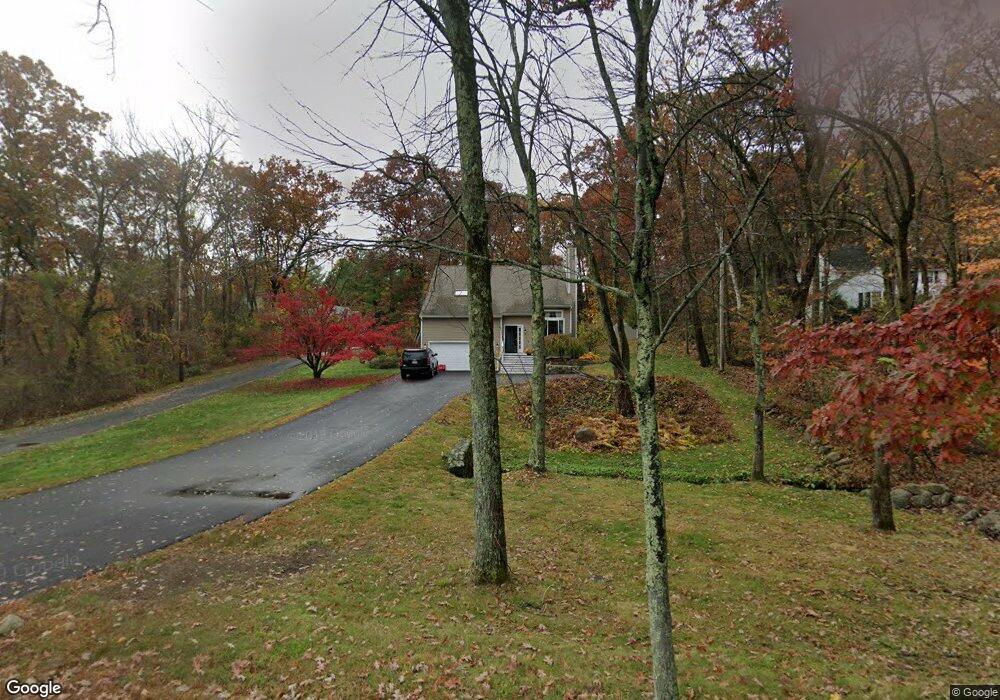
455 Chestnut St North Andover, MA 01845
Estimated Value: $934,013 - $963,000
4
Beds
2
Baths
2,632
Sq Ft
$362/Sq Ft
Est. Value
About This Home
This home is located at 455 Chestnut St, North Andover, MA 01845 and is currently estimated at $953,753, approximately $362 per square foot. 455 Chestnut St is a home located in Essex County with nearby schools including Franklin Elementary School, North Andover Middle School, and North Andover High School.
Ownership History
Date
Name
Owned For
Owner Type
Purchase Details
Closed on
Jul 21, 2011
Sold by
Ohagan J Barry and Ohagan Marie E
Bought by
Knoblauch Christopher D and Knoblauch Kimberly L
Current Estimated Value
Home Financials for this Owner
Home Financials are based on the most recent Mortgage that was taken out on this home.
Original Mortgage
$432,000
Outstanding Balance
$296,922
Interest Rate
4.49%
Mortgage Type
Purchase Money Mortgage
Estimated Equity
$656,831
Create a Home Valuation Report for This Property
The Home Valuation Report is an in-depth analysis detailing your home's value as well as a comparison with similar homes in the area
Home Values in the Area
Average Home Value in this Area
Purchase History
| Date | Buyer | Sale Price | Title Company |
|---|---|---|---|
| Knoblauch Christopher D | $16,534 | -- |
Source: Public Records
Mortgage History
| Date | Status | Borrower | Loan Amount |
|---|---|---|---|
| Open | Knoblauch Christopher D | $432,000 |
Source: Public Records
Tax History Compared to Growth
Tax History
| Year | Tax Paid | Tax Assessment Tax Assessment Total Assessment is a certain percentage of the fair market value that is determined by local assessors to be the total taxable value of land and additions on the property. | Land | Improvement |
|---|---|---|---|---|
| 2025 | $9,061 | $804,700 | $380,800 | $423,900 |
| 2024 | $8,408 | $758,200 | $360,700 | $397,500 |
| 2023 | $7,886 | $644,300 | $304,600 | $339,700 |
| 2022 | $7,930 | $586,100 | $276,500 | $309,600 |
| 2021 | $7,619 | $537,700 | $250,500 | $287,200 |
| 2020 | $7,196 | $523,700 | $250,500 | $273,200 |
| 2019 | $7,023 | $523,700 | $250,500 | $273,200 |
| 2018 | $7,609 | $523,700 | $250,500 | $273,200 |
| 2017 | $6,909 | $483,800 | $207,400 | $276,400 |
| 2016 | $6,529 | $457,500 | $206,100 | $251,400 |
| 2015 | $5,998 | $416,800 | $198,900 | $217,900 |
Source: Public Records
Map
Nearby Homes
- 124 Hillside Rd
- 122 Lisa Ln
- 34 Rosemont Dr
- 495 Johnson St
- 80 Sandra Ln
- 316 Johnson St
- 174 Chestnut St Unit 14
- 156 Chestnut St Unit 15
- 58 Berkeley Rd
- 40 Flagship Dr
- 29 Heath Rd
- 204 Chestnut St
- 26 Woodberry Ln
- 74 Hewitt Ave
- 75 Thistle Rd
- 180 Chestnut St
- 12 Farnum St
- 127 Tucker Farm Rd
- 2 Kingston St Unit 2
- 3 Great Pond Rd
- 445 Chestnut St
- 435 Chestnut St
- 465 Chestnut St
- 114 Blueberry Hill Ln
- 470 Chestnut St
- 460 Chestnut St
- 425 Chestnut St
- 104 Blueberry Hill Ln
- 480 Chestnut St
- 34 Wesley St
- 450 Chestnut St
- 124 Blueberry Hill Ln
- 94 Blueberry Hill Ln
- 486 Chestnut St
- 42 Wesley St
- 50 Saville St
- 440 Chestnut St
- 415 Chestnut St
- 84 Blueberry Hill Ln
- 3 Saville St