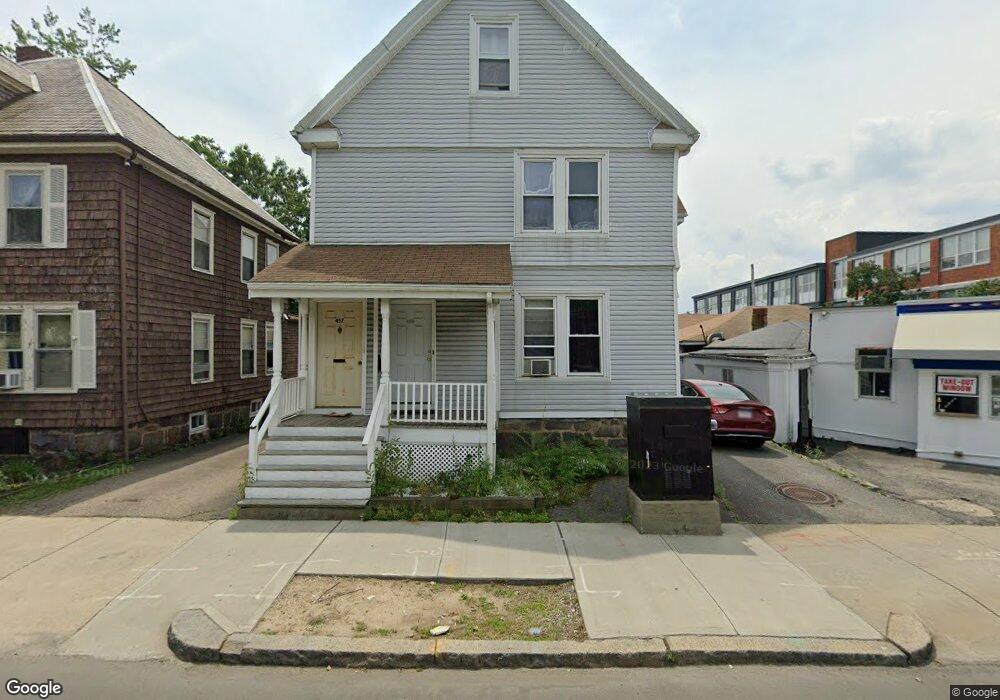
455 Hancock St Quincy, MA 02171
Montclair NeighborhoodEstimated Value: $964,000 - $1,133,000
7
Beds
3
Baths
2,537
Sq Ft
$423/Sq Ft
Est. Value
About This Home
This home is located at 455 Hancock St, Quincy, MA 02171 and is currently estimated at $1,073,000, approximately $422 per square foot. 455 Hancock St is a home located in Norfolk County with nearby schools including Montclair Elementary School, Atlantic Middle School, and North Quincy High School.
Ownership History
Date
Name
Owned For
Owner Type
Purchase Details
Closed on
Jul 25, 2007
Sold by
Randall H Hard Securit
Bought by
Hard Randall H
Current Estimated Value
Purchase Details
Closed on
Mar 21, 1994
Sold by
Hard Randall H and Hard Frances E
Bought by
Tang Chi K and Tang Siu Sk
Home Financials for this Owner
Home Financials are based on the most recent Mortgage that was taken out on this home.
Original Mortgage
$50,000
Interest Rate
6.9%
Mortgage Type
Purchase Money Mortgage
Create a Home Valuation Report for This Property
The Home Valuation Report is an in-depth analysis detailing your home's value as well as a comparison with similar homes in the area
Home Values in the Area
Average Home Value in this Area
Purchase History
| Date | Buyer | Sale Price | Title Company |
|---|---|---|---|
| Hard Randall H | -- | -- | |
| Tang Chi K | $170,000 | -- |
Source: Public Records
Mortgage History
| Date | Status | Borrower | Loan Amount |
|---|---|---|---|
| Previous Owner | Tang Chi K | $50,000 |
Source: Public Records
Tax History Compared to Growth
Tax History
| Year | Tax Paid | Tax Assessment Tax Assessment Total Assessment is a certain percentage of the fair market value that is determined by local assessors to be the total taxable value of land and additions on the property. | Land | Improvement |
|---|---|---|---|---|
| 2025 | $10,610 | $920,200 | $326,400 | $593,800 |
| 2024 | $10,044 | $891,200 | $308,300 | $582,900 |
| 2023 | $9,171 | $824,000 | $280,300 | $543,700 |
| 2022 | $8,766 | $731,700 | $224,200 | $507,500 |
| 2021 | $8,076 | $665,200 | $224,200 | $441,000 |
| 2020 | $7,703 | $619,700 | $206,900 | $412,800 |
| 2019 | $7,677 | $611,700 | $198,900 | $412,800 |
| 2018 | $6,885 | $516,100 | $201,300 | $314,800 |
| 2017 | $6,874 | $485,100 | $183,000 | $302,100 |
| 2016 | $6,387 | $444,800 | $174,200 | $270,600 |
| 2015 | $6,234 | $427,000 | $163,700 | $263,300 |
| 2014 | $5,672 | $381,700 | $160,200 | $221,500 |
Source: Public Records
Map
Nearby Homes
- 511 Hancock St Unit 207
- 522 Hancock St
- 21 Linden St Unit 417
- 143 Arlington St
- 43 Ellington Rd
- 204 Farrington St
- 39 Fayette St Unit 102
- 101 Beach St
- 22 Beach St
- 115 W Squantum St Unit 810
- 115 W Squantum St Unit 907
- 237 Billings Rd
- 1 Edwin St Unit C
- 129 Beale St
- 65 - 67 Davis St
- 77 Botolph St
- 94 Newbury Ave Unit 100
- 72 Waterston Ave
- 158 W Elm Ave
- 176 W Elm Ave
- 455 Hancock St Unit 1
- 459 Hancock St
- 463 Hancock St
- 468 Hancock St
- 120 Holmes St Unit 321
- 120 Holmes St Unit 320
- 120 Holmes St Unit 319
- 120 Holmes St Unit 318
- 120 Holmes St Unit 317
- 120 Holmes St Unit 316
- 120 Holmes St Unit 315
- 120 Holmes St Unit 314
- 120 Holmes St Unit 313
- 120 Holmes St Unit 312
- 120 Holmes St Unit 311
- 120 Holmes St Unit 310
- 120 Holmes St Unit 308
- 120 Holmes St Unit 307
- 120 Holmes St Unit 306
- 120 Holmes St Unit 305