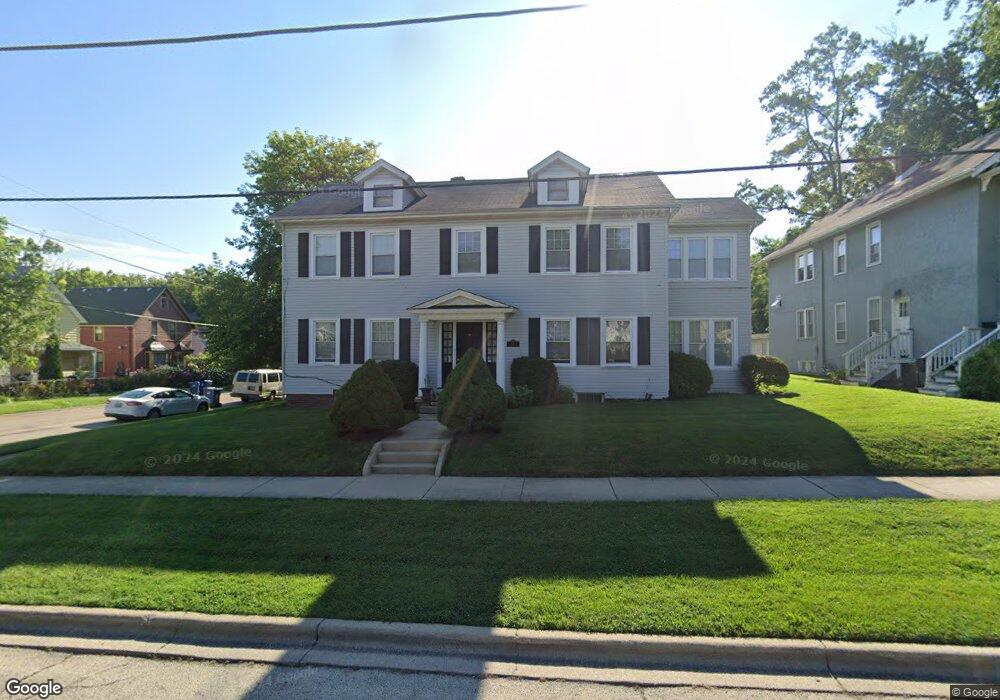
455 Hickory St Waukegan, IL 60085
Estimated Value: $260,400 - $328,000
4
Beds
2
Baths
2,656
Sq Ft
$110/Sq Ft
Est. Value
About This Home
This home is located at 455 Hickory St, Waukegan, IL 60085 and is currently estimated at $291,600, approximately $109 per square foot. 455 Hickory St is a home located in Lake County with nearby schools including Edith M Smith Middle School, Waukegan High School, and Most Blessed Trinity Academy.
Ownership History
Date
Name
Owned For
Owner Type
Purchase Details
Closed on
Jun 25, 2004
Sold by
Gonzalez Evaristo and Gonzalez Diana
Bought by
Kull Kimberly
Current Estimated Value
Home Financials for this Owner
Home Financials are based on the most recent Mortgage that was taken out on this home.
Original Mortgage
$166,500
Interest Rate
6.08%
Mortgage Type
Commercial
Purchase Details
Closed on
Dec 7, 2001
Sold by
Northside Community Bank
Bought by
Gonzalez Evaristo and Ramirez Diana
Home Financials for this Owner
Home Financials are based on the most recent Mortgage that was taken out on this home.
Original Mortgage
$160,471
Interest Rate
7.23%
Mortgage Type
FHA
Purchase Details
Closed on
Apr 16, 1998
Sold by
Marsoobian George G
Bought by
Northsidec Community Bank and Trust #987
Create a Home Valuation Report for This Property
The Home Valuation Report is an in-depth analysis detailing your home's value as well as a comparison with similar homes in the area
Home Values in the Area
Average Home Value in this Area
Purchase History
| Date | Buyer | Sale Price | Title Company |
|---|---|---|---|
| Kull Kimberly | $185,000 | Ticor Title Insurance Compan | |
| Gonzalez Evaristo | $163,000 | -- | |
| Northsidec Community Bank | -- | Chicago Title Insurance Co |
Source: Public Records
Mortgage History
| Date | Status | Borrower | Loan Amount |
|---|---|---|---|
| Previous Owner | Kull Kimberly | $166,500 | |
| Previous Owner | Gonzalez Evaristo | $160,471 |
Source: Public Records
Tax History Compared to Growth
Tax History
| Year | Tax Paid | Tax Assessment Tax Assessment Total Assessment is a certain percentage of the fair market value that is determined by local assessors to be the total taxable value of land and additions on the property. | Land | Improvement |
|---|---|---|---|---|
| 2024 | $6,684 | $78,650 | $7,508 | $71,142 |
| 2023 | $6,415 | $70,882 | $6,722 | $64,160 |
| 2022 | $6,415 | $65,618 | $6,394 | $59,224 |
| 2021 | $5,891 | $56,507 | $5,702 | $50,805 |
| 2020 | $5,967 | $52,643 | $5,312 | $47,331 |
| 2019 | $6,006 | $48,239 | $4,868 | $43,371 |
| 2018 | $5,485 | $42,427 | $6,202 | $36,225 |
| 2017 | $5,339 | $37,536 | $5,487 | $32,049 |
| 2016 | $5,040 | $32,617 | $4,768 | $27,849 |
| 2015 | $4,931 | $29,192 | $4,267 | $24,925 |
| 2014 | $5,084 | $30,047 | $3,375 | $26,672 |
| 2012 | $6,300 | $32,555 | $3,657 | $28,898 |
Source: Public Records
Map
Nearby Homes
- 452 North Ave
- 428 N Poplar St
- 522 N Poplar St
- 511 Chestnut St
- 702 Franklin St
- 620 N Poplar St
- 325 4th St
- 222 Grand Ave
- 611 N Genesee St
- 723 N County St
- 918 N Ash St
- 415 W Ridgeland Ave
- 28 N Saint James St
- 509 N Butrick St
- 1109 Massena Ave
- 613 Washington St
- 917 N Linden Ave
- 1110 N Ash St
- 23 N Jackson St
- 1122 N Ash St