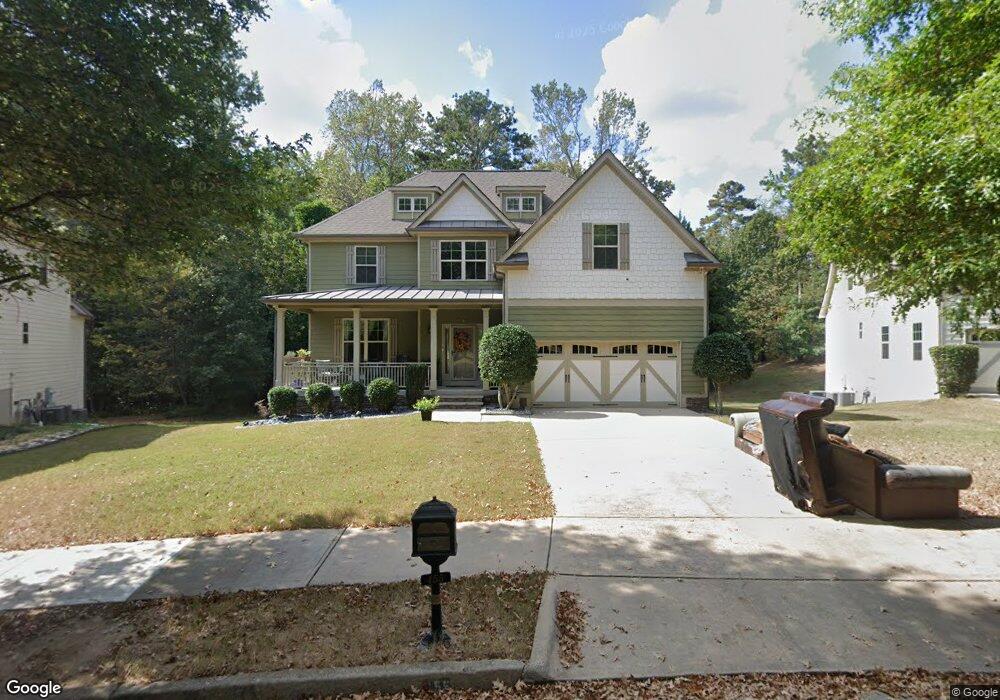
455 Lafayette Ave Fayetteville, GA 30214
Estimated Value: $598,000 - $640,000
5
Beds
4
Baths
3,892
Sq Ft
$160/Sq Ft
Est. Value
About This Home
This home is located at 455 Lafayette Ave, Fayetteville, GA 30214 and is currently estimated at $624,342, approximately $160 per square foot. 455 Lafayette Ave is a home located in Fayette County with nearby schools including Spring Hill Elementary School, Bennett's Mill Middle School, and Fayette County High School.
Ownership History
Date
Name
Owned For
Owner Type
Purchase Details
Closed on
Dec 15, 2022
Sold by
Shoates Gerald A
Bought by
Shoates Gerald and Shoates Angela
Current Estimated Value
Purchase Details
Closed on
Aug 28, 2019
Sold by
Bowser Benny Darnel
Bought by
Shoates Gerald A and Shoates Angela Denice
Home Financials for this Owner
Home Financials are based on the most recent Mortgage that was taken out on this home.
Original Mortgage
$409,300
Interest Rate
3.7%
Mortgage Type
VA
Purchase Details
Closed on
Jun 6, 2014
Sold by
Chandler & Brown Llc
Bought by
Bowser Benny Darnel
Home Financials for this Owner
Home Financials are based on the most recent Mortgage that was taken out on this home.
Original Mortgage
$304,385
Interest Rate
4.25%
Mortgage Type
FHA
Purchase Details
Closed on
Sep 25, 2013
Sold by
Chandler Thomas B
Bought by
Chandler & Brown Llc
Create a Home Valuation Report for This Property
The Home Valuation Report is an in-depth analysis detailing your home's value as well as a comparison with similar homes in the area
Home Values in the Area
Average Home Value in this Area
Purchase History
| Date | Buyer | Sale Price | Title Company |
|---|---|---|---|
| Shoates Gerald | -- | -- | |
| Shoates Gerald A | $409,300 | -- | |
| Bowser Benny Darnel | $310,000 | -- | |
| Chandler & Brown Llc | -- | -- |
Source: Public Records
Mortgage History
| Date | Status | Borrower | Loan Amount |
|---|---|---|---|
| Previous Owner | Shoates Gerald A | $409,300 | |
| Previous Owner | Bowser Benny Darnel | $304,385 |
Source: Public Records
Tax History Compared to Growth
Tax History
| Year | Tax Paid | Tax Assessment Tax Assessment Total Assessment is a certain percentage of the fair market value that is determined by local assessors to be the total taxable value of land and additions on the property. | Land | Improvement |
|---|---|---|---|---|
| 2024 | $1,110 | $226,688 | $30,000 | $196,688 |
| 2023 | $824 | $206,040 | $30,000 | $176,040 |
| 2022 | $1,008 | $198,760 | $30,000 | $168,760 |
| 2021 | $628 | $161,600 | $30,000 | $131,600 |
| 2020 | $705 | $156,960 | $22,800 | $134,160 |
| 2019 | $4,797 | $155,680 | $22,800 | $132,880 |
| 2018 | $4,622 | $148,520 | $22,800 | $125,720 |
| 2017 | $4,658 | $157,960 | $22,800 | $135,160 |
| 2016 | $4,267 | $141,840 | $22,800 | $119,040 |
| 2015 | $3,788 | $121,760 | $19,200 | $102,560 |
| 2014 | $3,470 | $109,480 | $19,200 | $90,280 |
| 2013 | -- | $5,184 | $0 | $0 |
Source: Public Records
Map
Nearby Homes
- 210 Colonial Ct
- 405 415 Chase Dr
- 550 Thatch Terrace
- 325 Enchanted Ct
- 115 Climbing Ivy Cir
- 125 Climbing Ivy Cir
- Thornewood Plan at Village Towns
- 1305 & 1307 Highway 54
- 160 Winona Dr
- 105 Deep Forest Ln
- 120 Deep Forest Ln Unit 1
- 350 Forrest Ave
- GA 85 S GA Highway 85
- 315 Enchanted Ct
- 295 Cobalt Dr
- 315 Cobalt Dr
- 305 Cobalt Dr
- 4010 Diane Ln
- 4080 Diane Ln
- 180 Habersham Place
- 445 Lafayette Ave
- 465 Lafayette Ave
- N N Lafayette Ave Unit LOT 18
- N N Lafayette Ave Unit LOT 11
- N N Lafayette Ave Unit LOT 13
- N N Lafayette Ave Unit 17
- N N Lafayette Ave
- 435 Lafayette Ave
- 475 Lafayette Ave Unit /5
- 475 Lafayette Ave
- 440 Lafayette Ave
- 485 Lafayette Ave Unit 4
- 485 Lafayette Ave
- 425 Lafayette Ave
- 190 Pye Ct
- 460 Lafayette Ave
- 325 Sharon Dr
- 305 Sharon Dr Unit 2
- 430 Lafayette Ave
- 480 Lafayette Ave