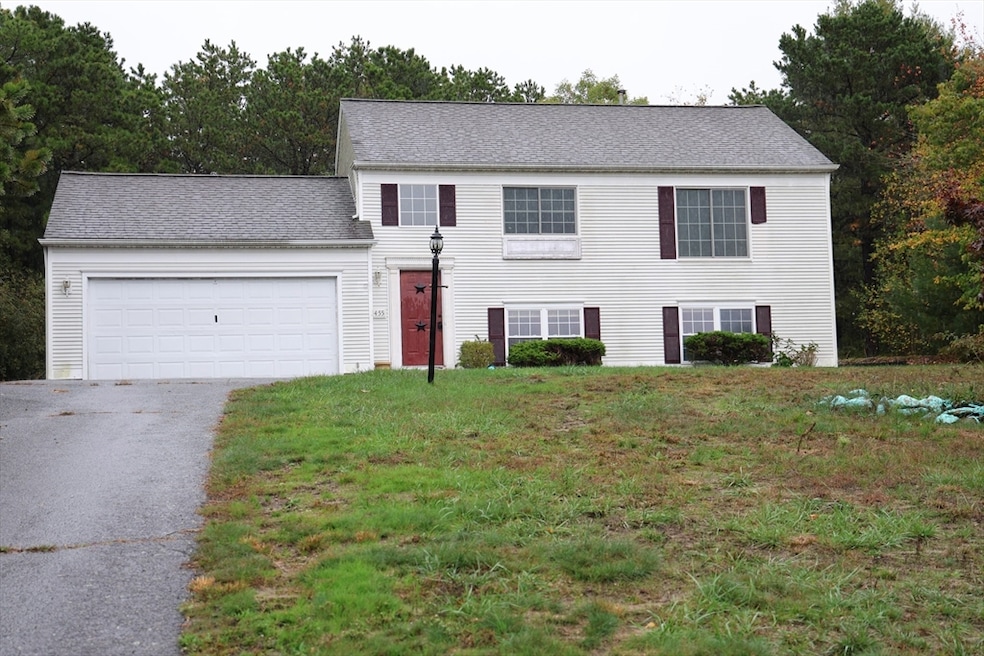
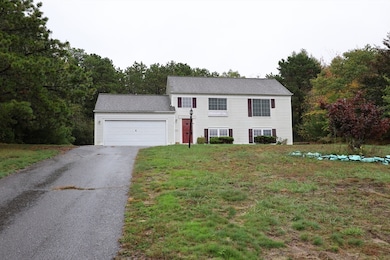
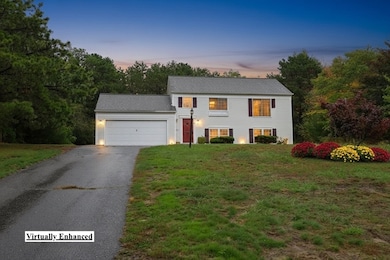

455 Lunns Way Plymouth, MA 02360
Estimated payment $3,670/month
Highlights
- Golf Course Community
- Custom Closet System
- Vaulted Ceiling
- Open Floorplan
- Deck
- Raised Ranch Architecture
About This Home
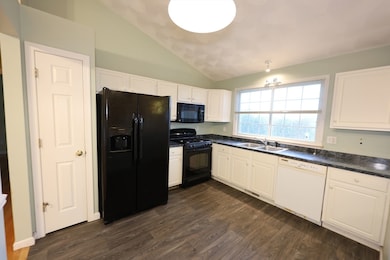
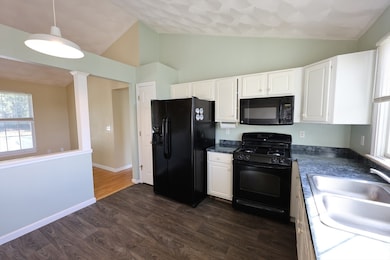
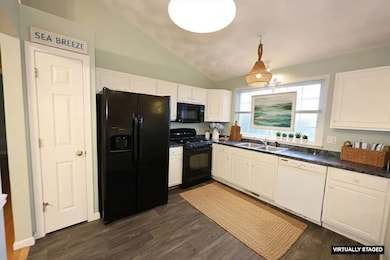
Located at 455 Lunns Way, Plymouth, MA, this inviting home in Plymouth County presents an exceptional opportunity to embrace a comfortable and convenient lifestyle in a ready-to-move-in condition. The living room stands as a testament to spacious design, featuring a high ceiling that amplifies the sense of openness, further enhanced by a vaulted ceiling that draws the eye upward, creating an airy and bright atmosphere, perfect for both relaxation and entertaining. Within the kitchen, the kitchen peninsula offers a practical space for meal preparation or casual dining, complemented by the classic aesthetic of shaker cabinets, which provide ample storage and contribute to the home's overall charm. This single-family residence boasts three bedrooms and two full bathrooms, providing comfortable accommodations. A walk-in closet offers generous storage, promoting an organized living space. Brand new water heat installed!!
Home Details
Home Type
- Single Family
Est. Annual Taxes
- $6,134
Year Built
- Built in 1998
Lot Details
- 0.66 Acre Lot
- Sloped Lot
- Property is zoned R25
Parking
- 2 Car Attached Garage
- Off-Street Parking
Home Design
- Raised Ranch Architecture
- Frame Construction
- Shingle Roof
- Concrete Perimeter Foundation
Interior Spaces
- Open Floorplan
- Vaulted Ceiling
- Ceiling Fan
- Washer and Electric Dryer Hookup
Kitchen
- Range
- Dishwasher
Flooring
- Wood
- Wall to Wall Carpet
- Marble
- Ceramic Tile
- Vinyl
Bedrooms and Bathrooms
- 3 Bedrooms
- Primary Bedroom on Main
- Custom Closet System
- Walk-In Closet
- 2 Full Bathrooms
Partially Finished Basement
- Basement Fills Entire Space Under The House
- Laundry in Basement
Outdoor Features
- Deck
- Outdoor Storage
- Rain Gutters
Location
- Property is near schools
Utilities
- Forced Air Heating and Cooling System
- Gas Water Heater
- Private Sewer
- Cable TV Available
Listing and Financial Details
- Assessor Parcel Number 3953677
Community Details
Overview
- No Home Owners Association
- Near Conservation Area
Amenities
- Shops
- Coin Laundry
Recreation
- Golf Course Community
Map
Home Values in the Area
Average Home Value in this Area
Tax History
| Year | Tax Paid | Tax Assessment Tax Assessment Total Assessment is a certain percentage of the fair market value that is determined by local assessors to be the total taxable value of land and additions on the property. | Land | Improvement |
|---|---|---|---|---|
| 2025 | $6,134 | $483,400 | $205,000 | $278,400 |
| 2024 | $5,840 | $453,800 | $195,000 | $258,800 |
| 2023 | $5,658 | $412,700 | $177,000 | $235,700 |
| 2022 | $5,166 | $334,800 | $161,800 | $173,000 |
| 2021 | $4,958 | $306,800 | $161,800 | $145,000 |
| 2020 | $4,683 | $286,400 | $161,800 | $124,600 |
| 2019 | $4,474 | $270,500 | $146,800 | $123,700 |
| 2018 | $4,271 | $259,500 | $136,800 | $122,700 |
| 2017 | $4,125 | $248,800 | $136,800 | $112,000 |
| 2016 | $3,898 | $239,600 | $126,800 | $112,800 |
| 2015 | $3,579 | $230,300 | $116,800 | $113,500 |
| 2014 | $3,436 | $227,100 | $116,800 | $110,300 |
Property History
| Date | Event | Price | List to Sale | Price per Sq Ft |
|---|---|---|---|---|
| 10/21/2025 10/21/25 | Price Changed | $599,900 | -4.8% | $414 / Sq Ft |
| 09/27/2025 09/27/25 | For Sale | $629,900 | -- | $434 / Sq Ft |
Purchase History
| Date | Type | Sale Price | Title Company |
|---|---|---|---|
| Land Court Massachusetts | $261,000 | -- | |
| Land Court Massachusetts | $259,900 | -- | |
| Land Court Massachusetts | $136,107 | -- |
Mortgage History
| Date | Status | Loan Amount | Loan Type |
|---|---|---|---|
| Open | $208,800 | Purchase Money Mortgage | |
| Previous Owner | $175,000 | Purchase Money Mortgage | |
| Previous Owner | $134,406 | Purchase Money Mortgage |
Source: MLS Property Information Network (MLS PIN)
MLS Number: 73436595
APN: PLYM-000122-000010P-001168
Disclaimer: Certain information contained herein is derived from information provided by parties other than Homes.com. All information provided is deemed reliable, but is not guaranteed to be accurate and should be independently verified.
![]() The property listing data and information, or the Images, set forth herein were provided to MLS Property Information Network, Inc. from third party sources, including sellers, lessors and public records, and were compiled by MLS Property Information Network, Inc. The property listing data and information, and the Images, are for the personal, non-commercial use of consumers having a good faith interest in purchasing or leasing listed properties of the type displayed to them and may not be used for any purpose other than to identify prospective properties which such consumers may have a good faith interest in purchasing or leasing. MLS Property Information Network, Inc. and its subscribers disclaim any and all representations and warranties as to the accuracy of the property listing data and information, or as to the accuracy of any of the Images, set forth herein.
The property listing data and information, or the Images, set forth herein were provided to MLS Property Information Network, Inc. from third party sources, including sellers, lessors and public records, and were compiled by MLS Property Information Network, Inc. The property listing data and information, and the Images, are for the personal, non-commercial use of consumers having a good faith interest in purchasing or leasing listed properties of the type displayed to them and may not be used for any purpose other than to identify prospective properties which such consumers may have a good faith interest in purchasing or leasing. MLS Property Information Network, Inc. and its subscribers disclaim any and all representations and warranties as to the accuracy of the property listing data and information, or as to the accuracy of any of the Images, set forth herein.
- 28 Paulette Terrace
- 4 Oriole Way
- 63 Pioneer Trail
- 7 Tadpole Way
- 4 Tadpole Way
- 12 Tradewind Ln
- 671 Lunns Way
- 249 Little Sandy Pond Rd
- 375 Little Sandy Pond Rd
- 7 Central Ave
- 9 Headlands Dr
- 242 Hedges Pond Rd
- 196 Bourne Rd
- 44 Pisces Ln
- 32 Lake View Blvd
- 879 Long Pond Rd
- 110 Valley Rd
- 885 Long Pond Rd
- 31 Fortune Dr
- 20 Towering Trees Rd
- 220 Wareham Rd
- 4 Oaken Bucket Ln
- 68 Post n Rail Ave
- 561 White Cliff Dr Unit 561
- 561 White Cliff Dr Unit Winter
- 633 Wareham Rd Unit 1
- 619 White Cliff Dr
- 42 Oak Bluff Cir Unit H
- 64 Cliffside Dr Unit Off Season
- 64 Cliffside Dr Unit 64
- 90 Lookout Point Rd
- 211 Clark Rd
- 62 Station Dr
- 40 Pinehills Dr
- 372 Phillips Rd
- 9 Village Green S
- One Avalon Way
- 1 Avalon Way Unit FL2-ID5238A
- 1 Avalon Way Unit FL1-ID5518A
- 1 Avalon Way Unit FL2-ID4562A
