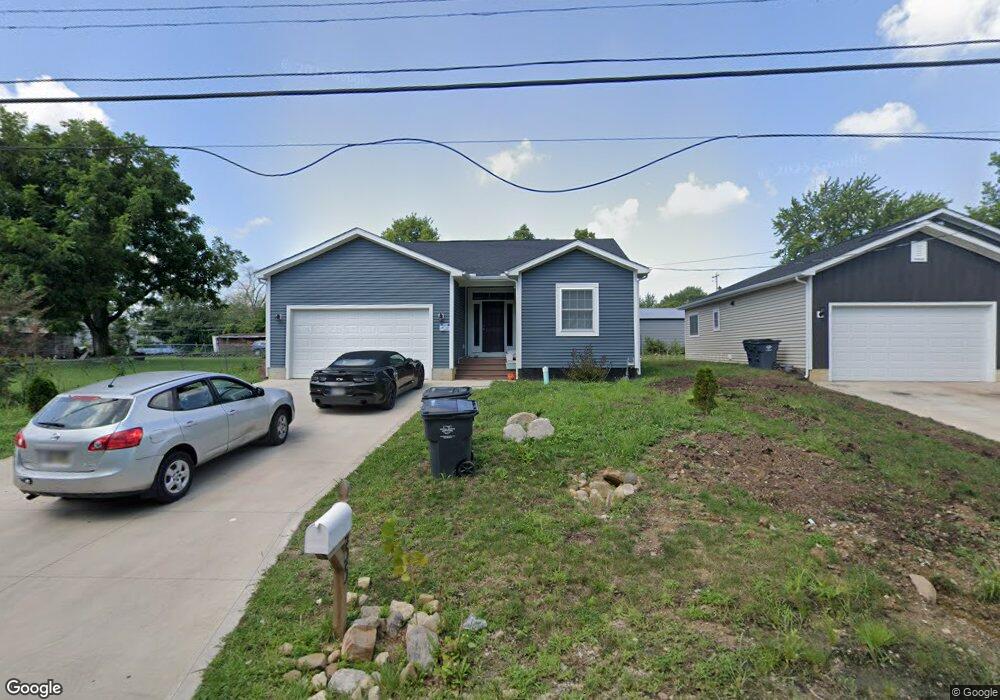
455 Mix Ave Columbus, OH 43228
Estimated Value: $211,000 - $509,000
3
Beds
2
Baths
1,277
Sq Ft
$237/Sq Ft
Est. Value
About This Home
This home is located at 455 Mix Ave, Columbus, OH 43228 and is currently estimated at $302,833, approximately $237 per square foot. 455 Mix Ave is a home located in Franklin County with nearby schools including Stiles Elementary School, Galloway Ridge Intermediate School, and Norton Middle School.
Ownership History
Date
Name
Owned For
Owner Type
Purchase Details
Closed on
Nov 10, 2023
Sold by
Morquecho Wilson and Maguana Jennifer
Bought by
Luvex Capital Homes Llc
Current Estimated Value
Home Financials for this Owner
Home Financials are based on the most recent Mortgage that was taken out on this home.
Original Mortgage
$198,965
Interest Rate
7.57%
Mortgage Type
Credit Line Revolving
Purchase Details
Closed on
Nov 6, 2023
Sold by
Morquecho Wilson and Morquecho Jennifer
Bought by
Luvex Capital Homes Llc
Home Financials for this Owner
Home Financials are based on the most recent Mortgage that was taken out on this home.
Original Mortgage
$198,965
Interest Rate
7.57%
Mortgage Type
Credit Line Revolving
Purchase Details
Closed on
Oct 24, 2022
Sold by
Gooslin Jesse
Bought by
Morquecho Wilson
Purchase Details
Closed on
Sep 7, 2016
Sold by
Mingo Clarence
Bought by
Jack Estates Llc
Purchase Details
Closed on
Mar 28, 1974
Bought by
Stickles Richard
Create a Home Valuation Report for This Property
The Home Valuation Report is an in-depth analysis detailing your home's value as well as a comparison with similar homes in the area
Home Values in the Area
Average Home Value in this Area
Purchase History
| Date | Buyer | Sale Price | Title Company |
|---|---|---|---|
| Luvex Capital Homes Llc | -- | Pm Title | |
| Luvex Capital Homes Llc | -- | Pm Title | |
| Morquecho Wilson | $32,000 | -- | |
| Jack Estates Llc | -- | None Available | |
| Stickles Richard | -- | -- |
Source: Public Records
Mortgage History
| Date | Status | Borrower | Loan Amount |
|---|---|---|---|
| Previous Owner | Luvex Capital Homes Llc | $198,965 | |
| Previous Owner | Luvex Capital Homes Llc | $198,965 |
Source: Public Records
Tax History
| Year | Tax Paid | Tax Assessment Tax Assessment Total Assessment is a certain percentage of the fair market value that is determined by local assessors to be the total taxable value of land and additions on the property. | Land | Improvement |
|---|---|---|---|---|
| 2025 | $2,334 | $50,610 | $12,180 | $38,430 |
| 2024 | $2,334 | $50,610 | $12,180 | $38,430 |
| 2023 | $539 | $12,250 | $12,180 | $70 |
| 2022 | $7 | $110 | $70 | $40 |
| 2021 | $7 | $110 | $70 | $40 |
Source: Public Records
Map
Nearby Homes
- 546 Emmit Ave
- 377 S Murray Hill Rd
- 495 Daytona Rd
- 257 S Murray Hill Rd
- 470 Woodlawn Ave
- 4682 Arnold Ave
- 4637 Hilton Ave
- 4848 Deephollow Dr
- 415 Georgesville Rd
- 429 Postle Blvd
- 104 Oxley Rd
- 89 Postle Blvd
- 4723 Tarryton Ct S Unit 14-E
- 87 Tarryton Ct W Unit 18D
- 110 Inah Ave
- 97 Tarryton Ct W Unit 19-H
- 4518 Hall Rd
- 218 Darbyhurst Rd
- 329 Weymouth Ln
- 3977 Sexton Dr
Your Personal Tour Guide
Ask me questions while you tour the home.