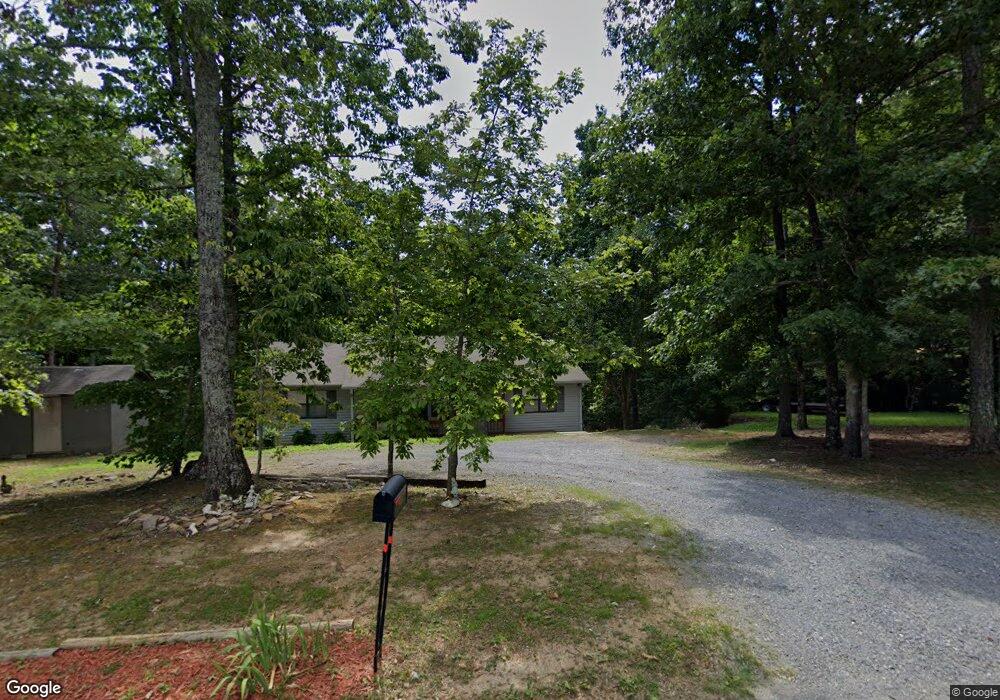
455 Orchard Rd Jasper, GA 30143
Estimated Value: $232,000 - $301,186
3
Beds
2
Baths
1,400
Sq Ft
$197/Sq Ft
Est. Value
About This Home
This home is located at 455 Orchard Rd, Jasper, GA 30143 and is currently estimated at $276,047, approximately $197 per square foot. 455 Orchard Rd is a home located in Pickens County with nearby schools including Tate Elementary School, Pickens County Middle School, and Pickens County High School.
Ownership History
Date
Name
Owned For
Owner Type
Purchase Details
Closed on
Sep 14, 2011
Sold by
Federal National Mortgage Asso
Bought by
Chumley Pamela
Current Estimated Value
Home Financials for this Owner
Home Financials are based on the most recent Mortgage that was taken out on this home.
Original Mortgage
$60,104
Outstanding Balance
$40,516
Interest Rate
4.24%
Mortgage Type
New Conventional
Estimated Equity
$235,531
Purchase Details
Closed on
May 3, 2011
Sold by
Bac Home Loan Servicing Lp
Bought by
Federal National Mortgage Association
Purchase Details
Closed on
Feb 23, 2007
Sold by
Johnson Sue
Bought by
Johnson Sue A
Home Financials for this Owner
Home Financials are based on the most recent Mortgage that was taken out on this home.
Original Mortgage
$140,000
Interest Rate
6.19%
Mortgage Type
New Conventional
Purchase Details
Closed on
Sep 29, 2005
Sold by
List Mark R
Bought by
Johnson Sue
Home Financials for this Owner
Home Financials are based on the most recent Mortgage that was taken out on this home.
Original Mortgage
$104,000
Interest Rate
6.95%
Mortgage Type
New Conventional
Purchase Details
Closed on
Oct 5, 2000
Bought by
List Mark R and List Bonnie
Purchase Details
Closed on
Jan 7, 2000
Bought by
M R List Construction Inc
Create a Home Valuation Report for This Property
The Home Valuation Report is an in-depth analysis detailing your home's value as well as a comparison with similar homes in the area
Home Values in the Area
Average Home Value in this Area
Purchase History
| Date | Buyer | Sale Price | Title Company |
|---|---|---|---|
| Chumley Pamela | -- | -- | |
| Federal National Mortgage Association | $48,400 | -- | |
| Bac Home Loan Servicing | -- | -- | |
| Johnson Sue A | -- | -- | |
| Johnson Sue | $130,000 | -- | |
| Johnson Sue | $130,000 | -- | |
| List Mark R | -- | -- | |
| M R List Construction Inc | -- | -- | |
| Brown Robert L | -- | -- |
Source: Public Records
Mortgage History
| Date | Status | Borrower | Loan Amount |
|---|---|---|---|
| Open | Chumley Pamela | $60,104 | |
| Previous Owner | Johnson Sue A | $140,000 | |
| Previous Owner | Johnson Sue | $104,000 | |
| Previous Owner | Johnson Sue | $26,000 |
Source: Public Records
Tax History
| Year | Tax Paid | Tax Assessment Tax Assessment Total Assessment is a certain percentage of the fair market value that is determined by local assessors to be the total taxable value of land and additions on the property. | Land | Improvement |
|---|---|---|---|---|
| 2025 | $1,527 | $89,293 | $18,000 | $71,293 |
| 2024 | $1,667 | $89,237 | $18,000 | $71,237 |
| 2023 | $1,713 | $89,237 | $18,000 | $71,237 |
| 2022 | $1,713 | $89,237 | $18,000 | $71,237 |
| 2021 | $873 | $45,075 | $12,000 | $33,075 |
| 2020 | $899 | $45,075 | $12,000 | $33,075 |
| 2019 | $920 | $45,075 | $12,000 | $33,075 |
| 2018 | $929 | $45,075 | $12,000 | $33,075 |
| 2017 | $944 | $45,075 | $12,000 | $33,075 |
| 2016 | $959 | $45,075 | $12,000 | $33,075 |
| 2015 | $937 | $45,075 | $12,000 | $33,075 |
| 2014 | $939 | $45,075 | $12,000 | $33,075 |
| 2013 | -- | $44,792 | $12,000 | $32,792 |
Source: Public Records
Map
Nearby Homes
- 0 Orchard Rd Unit 10643331
- 0 Orchard Rd Unit 7681112
- 164 Mossburg Trail
- 800 Browning Way
- 850 Browning Way
- 76 Remington Ln
- 335 Oak Morris Ridge
- 250 Oak Morris Ridge
- 64 Bull Gap Rd
- 85 Mauser Ct
- 91 Smith and Wesson Way
- 0 Mauser Ct Unit 10667385
- 0 Mauser Ct Unit 7715064
- 0 Mauser Ct Unit 10686076
- 0 Mauser Ct Unit 7700325
- 2232 Burnt Mountain Rd
- 13a Greystone Rd
- 988 Hunters Ridge
- 710 Lumber Company Rd
- 0 Redfield Way Unit 7714926
- 395 Orchard Rd
- 465 Orchard Rd
- 385 Orchard Rd
- 365 Orchard Rd
- 375 Orchard Rd
- 542 Orchard Rd
- 3210 Burnt Mountain Rd
- 518 Orchard Rd
- 355 Orchard Rd
- 574 Orchard Rd
- 485 Orchard Rd
- 3270 Burnt Mountain Rd
- 563 Orchard Rd
- 254 Orchard Ridge Trail
- 3440 Burnt Mountain Rd
- 179 Orchard Rd
- 3150 Burnt Mountain Rd
- 75 Orchard Rd
- 3450 Burnt Mountain Rd
- 123 Orchard Rd
Your Personal Tour Guide
Ask me questions while you tour the home.