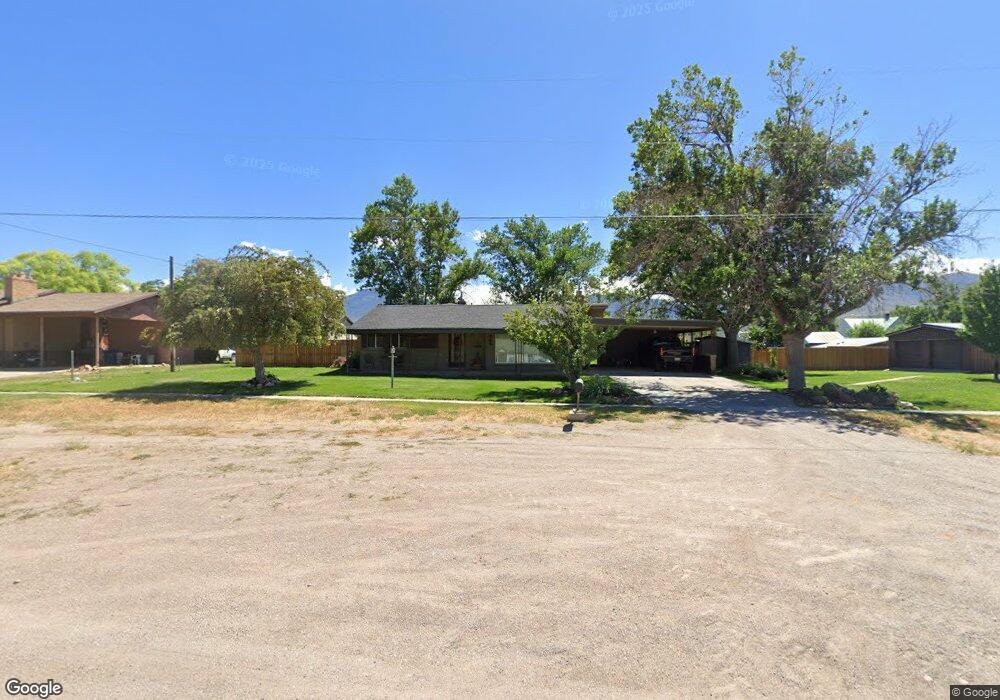
455 S 200 W Fillmore, UT 84631
Estimated Value: $314,000 - $394,652
3
Beds
3
Baths
1,816
Sq Ft
$192/Sq Ft
Est. Value
About This Home
This home is located at 455 S 200 W, Fillmore, UT 84631 and is currently estimated at $349,551, approximately $192 per square foot. 455 S 200 W is a home located in Millard County.
Ownership History
Date
Name
Owned For
Owner Type
Purchase Details
Closed on
Mar 25, 2021
Sold by
Mace Marlow D
Bought by
Carson David W and Carson Kathryn M
Current Estimated Value
Home Financials for this Owner
Home Financials are based on the most recent Mortgage that was taken out on this home.
Original Mortgage
$149,000
Outstanding Balance
$133,333
Interest Rate
2.73%
Mortgage Type
New Conventional
Estimated Equity
$216,218
Purchase Details
Closed on
Oct 3, 2012
Sold by
Mace Marlow and Mace Marlow D
Bought by
Mace Marlow D and Mace Sally J
Purchase Details
Closed on
Sep 27, 2012
Sold by
Iverson John C and Carter Michelle I
Bought by
Mace Marlow
Create a Home Valuation Report for This Property
The Home Valuation Report is an in-depth analysis detailing your home's value as well as a comparison with similar homes in the area
Home Values in the Area
Average Home Value in this Area
Purchase History
| Date | Buyer | Sale Price | Title Company |
|---|---|---|---|
| Carson David W | -- | First American Title | |
| Mace Marlow D | -- | First American Title Insuran | |
| Mace Marlow | -- | First American Title Insuran |
Source: Public Records
Mortgage History
| Date | Status | Borrower | Loan Amount |
|---|---|---|---|
| Open | Carson David W | $149,000 |
Source: Public Records
Tax History Compared to Growth
Tax History
| Year | Tax Paid | Tax Assessment Tax Assessment Total Assessment is a certain percentage of the fair market value that is determined by local assessors to be the total taxable value of land and additions on the property. | Land | Improvement |
|---|---|---|---|---|
| 2025 | $1,511 | $189,734 | $36,009 | $153,725 |
| 2024 | $1,511 | $167,588 | $27,672 | $139,916 |
| 2023 | $1,807 | $167,588 | $27,672 | $139,916 |
| 2022 | $1,490 | $133,822 | $25,156 | $108,666 |
| 2021 | $1,300 | $112,065 | $16,335 | $95,730 |
| 2020 | $1,204 | $104,370 | $14,850 | $89,520 |
| 2019 | $1,028 | $89,396 | $14,850 | $74,546 |
| 2018 | $980 | $87,294 | $14,850 | $72,444 |
| 2017 | $853 | $72,166 | $14,850 | $57,316 |
| 2016 | $815 | $72,166 | $14,850 | $57,316 |
| 2015 | $816 | $72,166 | $14,850 | $57,316 |
| 2014 | -- | $72,166 | $14,850 | $57,316 |
| 2013 | -- | $70,791 | $14,850 | $55,941 |
Source: Public Records
Map
Nearby Homes
- 190 W 400 St S
- 155 E 500 St S
- 157 E 500 South St
- 310 S 500 West Rd
- 220 S 200 E
- 405 E 500 St S
- 40 S 100 Rd E
- 75 N 100 West St
- 430 E Canyon Rd
- 760 E 700 St S
- 165 N 100 W
- 225 W 200 St N
- 310 S 600 E
- 1100 S 725 Rd W
- 295 N 100 West St
- 690 E 500 S
- 380 N 200 St W
- 390 N 100 W
- 335 W 400 North St
- 750 800 South Fillmore