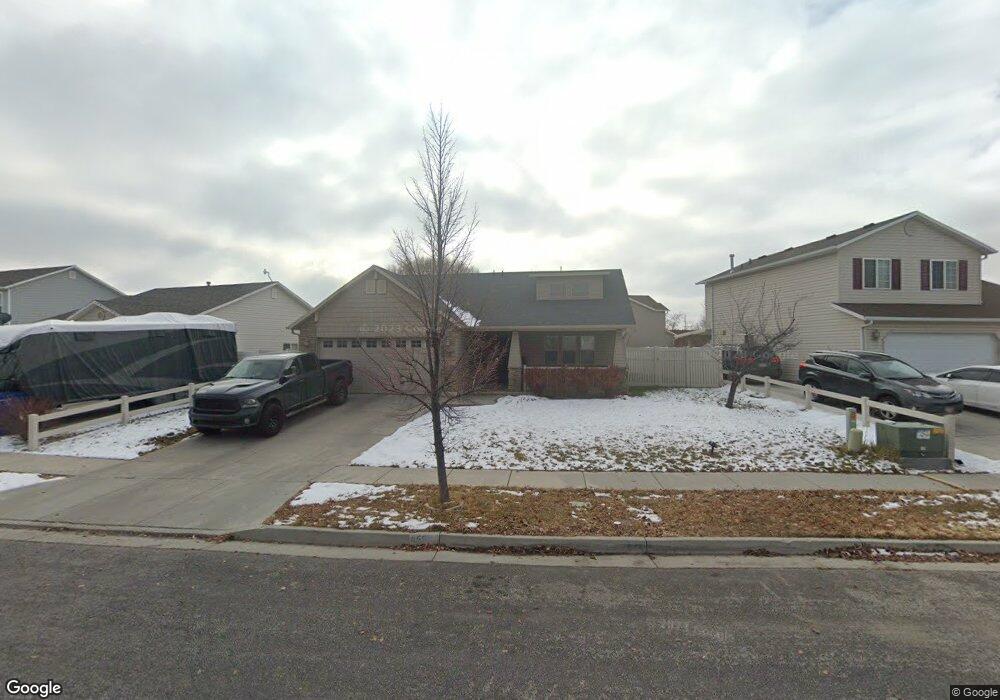
455 Stone Pond Rd Ogden, UT 84404
Lynn NeighborhoodEstimated Value: $408,000 - $431,000
3
Beds
2
Baths
1,354
Sq Ft
$309/Sq Ft
Est. Value
About This Home
This home is located at 455 Stone Pond Rd, Ogden, UT 84404 and is currently estimated at $418,908, approximately $309 per square foot. 455 Stone Pond Rd is a home located in Weber County with nearby schools including Heritage Elementary School, Highland Junior High School, and Ben Lomond High School.
Ownership History
Date
Name
Owned For
Owner Type
Purchase Details
Closed on
Nov 30, 2012
Sold by
Sweeney George G
Bought by
Ah4r Ut Llc
Current Estimated Value
Purchase Details
Closed on
May 17, 2005
Sold by
Lumbermens Investment Corp
Bought by
Aspen Homes Development Inc
Home Financials for this Owner
Home Financials are based on the most recent Mortgage that was taken out on this home.
Original Mortgage
$108,000
Interest Rate
5.84%
Mortgage Type
Construction
Purchase Details
Closed on
Apr 21, 2005
Sold by
Aspen Homes Development Inc
Bought by
Sweeney George G
Home Financials for this Owner
Home Financials are based on the most recent Mortgage that was taken out on this home.
Original Mortgage
$108,000
Interest Rate
5.84%
Mortgage Type
Construction
Create a Home Valuation Report for This Property
The Home Valuation Report is an in-depth analysis detailing your home's value as well as a comparison with similar homes in the area
Home Values in the Area
Average Home Value in this Area
Purchase History
| Date | Buyer | Sale Price | Title Company |
|---|---|---|---|
| Ah4r Ut Llc | -- | Beckman Title Services Ltd | |
| Aspen Homes Development Inc | -- | Mountain View Title Ogden | |
| Sweeney George G | -- | Mountain View Title Ogden |
Source: Public Records
Mortgage History
| Date | Status | Borrower | Loan Amount |
|---|---|---|---|
| Previous Owner | Aspen Homes Development Inc | $108,000 |
Source: Public Records
Tax History Compared to Growth
Tax History
| Year | Tax Paid | Tax Assessment Tax Assessment Total Assessment is a certain percentage of the fair market value that is determined by local assessors to be the total taxable value of land and additions on the property. | Land | Improvement |
|---|---|---|---|---|
| 2025 | $2,535 | $385,892 | $128,128 | $257,764 |
| 2024 | $2,535 | $365,000 | $128,133 | $236,867 |
| 2023 | $2,706 | $392,000 | $123,598 | $268,402 |
| 2022 | $2,575 | $374,000 | $93,928 | $280,072 |
| 2021 | $2,210 | $293,000 | $68,981 | $224,019 |
| 2020 | $2,147 | $263,000 | $54,192 | $208,808 |
| 2019 | $2,087 | $240,000 | $44,164 | $195,836 |
| 2018 | $1,794 | $205,000 | $44,164 | $160,836 |
| 2017 | $1,630 | $174,000 | $39,455 | $134,545 |
| 2016 | $1,417 | $81,767 | $21,181 | $60,586 |
| 2015 | $1,437 | $80,912 | $21,181 | $59,731 |
| 2014 | $1,393 | $77,016 | $18,519 | $58,497 |
Source: Public Records
Map
Nearby Homes
- 352 N Sam Gates Rd
- 101 S Century Dr Unit 101
- 5332 S Century Way W Unit 111
- 305 N Wall Ave
- 142 W 2nd St
- 197 W 2nd St
- 152 W 2nd St
- 360 N Wall Ave
- 117 North St
- 151 E Southwell St Unit 9
- 382 W Oaks Dr Unit W
- 449 Downs Dr
- 511 E Douglas St
- 333 Childs Ave Unit 16C
- 244 W Downs Cir
- 200 N Harrisville Rd Unit 44
- 200 N Harrisville Rd Unit 8
- 636 Downs Dr
- 265 E Larsen Ln
- 1636 Washington Blvd
- 449 Stone Pond Rd
- 463 Stone Pond Rd
- 280 N Sam Gates Rd
- 443 Stone Pond Rd
- 270 N Sam Gates Rd
- 319 N 440 W
- 204 N Sam Gates Rd
- 464 Stone Pond Rd
- 181 N Sam Gates Rd
- 437 Stone Pond Rd
- 480 Stone Ct
- 271 N Century Dr
- 438 Stone Pond Rd
- 260 N Sam Gates Rd
- 331 N 440 W
- 263 N Century Dr
- 488 Stone Ct
- 481 Stone Ct
- 330 N Sam Gates Rd
- 432 Stone Pond Rd