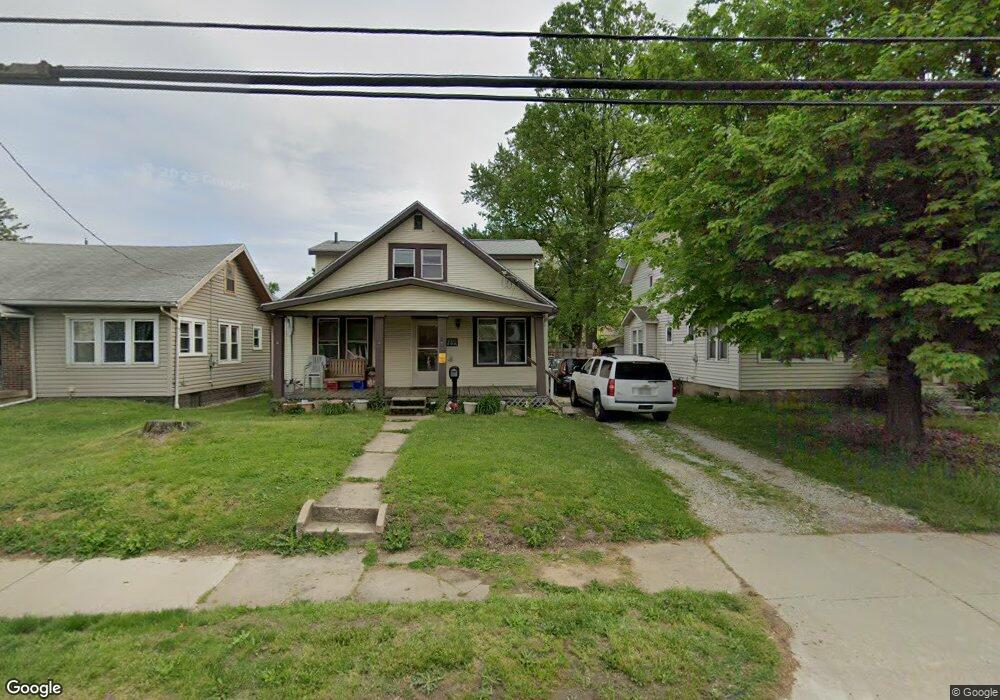
455 W Waterloo Rd Akron, OH 44314
Kenmore NeighborhoodEstimated Value: $135,304 - $142,000
3
Beds
2
Baths
1,125
Sq Ft
$123/Sq Ft
Est. Value
About This Home
This home is located at 455 W Waterloo Rd, Akron, OH 44314 and is currently estimated at $138,826, approximately $123 per square foot. 455 W Waterloo Rd is a home located in Summit County with nearby schools including St. Francis de Sales School and Sam Salem Community Learning Center.
Ownership History
Date
Name
Owned For
Owner Type
Purchase Details
Closed on
Jan 24, 2016
Sold by
Edsall Jason M
Bought by
Edsall Lia J
Current Estimated Value
Purchase Details
Closed on
May 15, 2006
Sold by
Edsall Lia J and Perfetto Lia J
Bought by
Edsall Jason M and Edsall Lia J
Home Financials for this Owner
Home Financials are based on the most recent Mortgage that was taken out on this home.
Original Mortgage
$82,190
Outstanding Balance
$47,981
Interest Rate
6.54%
Mortgage Type
Fannie Mae Freddie Mac
Estimated Equity
$90,845
Purchase Details
Closed on
Nov 5, 2003
Sold by
Richard P Martin Co Lpa Money Purchase P
Bought by
Perfetto Lia J
Home Financials for this Owner
Home Financials are based on the most recent Mortgage that was taken out on this home.
Original Mortgage
$69,500
Interest Rate
7.92%
Mortgage Type
Stand Alone First
Purchase Details
Closed on
Feb 15, 2001
Sold by
Page Gary B and Page Cindy L
Bought by
Richard P Martin Co Lpa Money Purchase P
Create a Home Valuation Report for This Property
The Home Valuation Report is an in-depth analysis detailing your home's value as well as a comparison with similar homes in the area
Home Values in the Area
Average Home Value in this Area
Purchase History
| Date | Buyer | Sale Price | Title Company |
|---|---|---|---|
| Edsall Lia J | -- | None Available | |
| Edsall Jason M | -- | Tier One Title | |
| Perfetto Lia J | $69,500 | Portage Lawyers Title | |
| Richard P Martin Co Lpa Money Purchase P | $48,000 | Midland Commerce Group |
Source: Public Records
Mortgage History
| Date | Status | Borrower | Loan Amount |
|---|---|---|---|
| Open | Edsall Jason M | $82,190 | |
| Closed | Perfetto Lia J | $69,500 |
Source: Public Records
Tax History Compared to Growth
Tax History
| Year | Tax Paid | Tax Assessment Tax Assessment Total Assessment is a certain percentage of the fair market value that is determined by local assessors to be the total taxable value of land and additions on the property. | Land | Improvement |
|---|---|---|---|---|
| 2025 | $2,098 | $37,384 | $9,156 | $28,228 |
| 2024 | $2,098 | $37,384 | $9,156 | $28,228 |
| 2023 | $2,098 | $37,384 | $9,156 | $28,228 |
| 2022 | $1,671 | $23,619 | $5,583 | $18,036 |
| 2021 | $1,647 | $23,619 | $5,583 | $18,036 |
| 2020 | $1,623 | $23,620 | $5,580 | $18,040 |
| 2019 | $1,460 | $19,160 | $6,070 | $13,090 |
| 2018 | $1,441 | $19,160 | $6,070 | $13,090 |
| 2017 | $1,551 | $19,160 | $6,070 | $13,090 |
| 2016 | $1,553 | $19,160 | $6,070 | $13,090 |
| 2015 | $1,551 | $19,160 | $6,070 | $13,090 |
| 2014 | $1,540 | $19,160 | $6,070 | $13,090 |
| 2013 | $1,521 | $19,300 | $6,070 | $13,230 |
Source: Public Records
Map
Nearby Homes
- 2531 Pelton Ave
- 2513 Christensen Ave
- 364 Rexford St
- 363 Lockwood St
- 355 Lockwood St
- 2365 Pelton Ave
- 2785 Nesmith Lake Blvd
- 451 Allenford St
- 590 Flora Ave
- 636 Flora Ave
- 55 W Ralston Ave
- 41 W Woodsdale Ave
- 17 W Woodsdale Ave
- 2303 6th St SW
- 32 Joyce Ave
- 2784 Conway St
- 2256 Maryland Ave
- 0 Joyce Ave NW Unit 35 5043152
- 0 Joyce Ave NW Unit 34 5043158
- 838 Stanwood Ave
- 461 W Waterloo Rd
- 2511 Conrad Ave
- 447 W Waterloo Rd
- 2524 Edwin Ave
- 471 W Waterloo Rd
- 443 W Waterloo Rd
- 2506 Edwin Ave
- 2507 Conrad Ave
- 450 W Waterloo Rd
- 460 W Waterloo Rd
- 2512 Conrad Ave
- 2498 Edwin Ave
- 2508 Conrad Ave
- 2495 Conrad Ave
- 2495 Conrad Ave
- 431 W Waterloo Rd
- 431 W Waterloo Rd Unit D
- 2494 Edwin Ave
- 472 W Waterloo Rd
- 2504 Conrad Ave