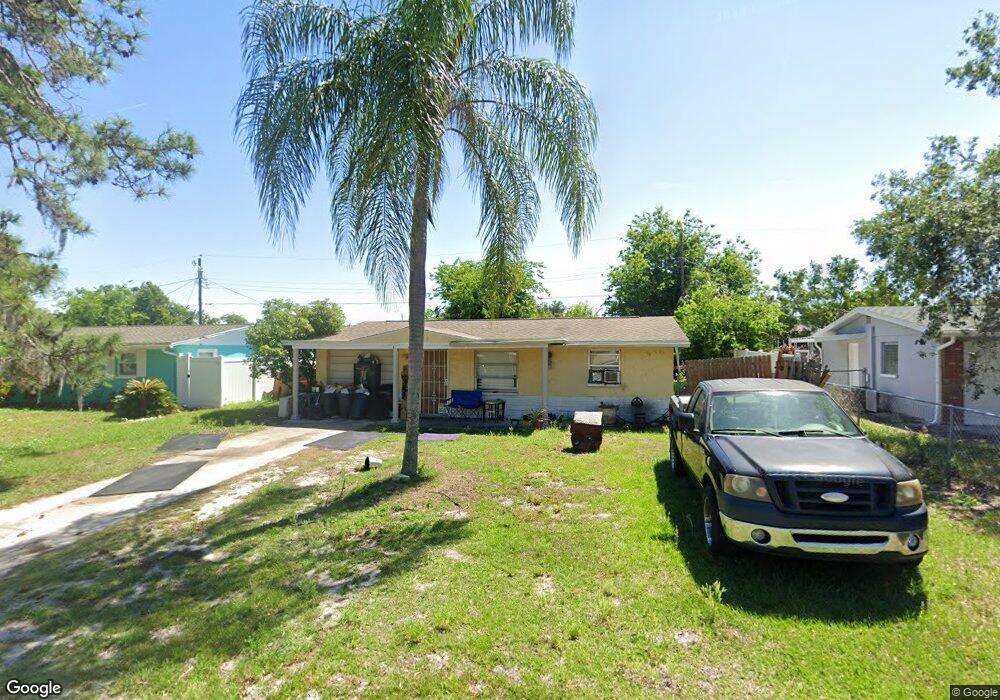
4550 Irene Loop New Port Richey, FL 34652
South New Port Richey NeighborhoodEstimated Value: $119,943 - $168,000
2
Beds
1
Bath
624
Sq Ft
$242/Sq Ft
Est. Value
About This Home
This home is located at 4550 Irene Loop, New Port Richey, FL 34652 and is currently estimated at $150,736, approximately $241 per square foot. 4550 Irene Loop is a home located in Pasco County with nearby schools including Mittye P. Locke Elementary School, Gulf Trace Elementary School, and Paul R. Smith Middle School.
Ownership History
Date
Name
Owned For
Owner Type
Purchase Details
Closed on
Nov 29, 2017
Sold by
Mills Joseph V
Bought by
Mills Bros Llc
Current Estimated Value
Purchase Details
Closed on
May 30, 2017
Sold by
Mills Bros Llc
Bought by
Mills Joseph V
Home Financials for this Owner
Home Financials are based on the most recent Mortgage that was taken out on this home.
Original Mortgage
$38,250
Interest Rate
3.97%
Mortgage Type
New Conventional
Purchase Details
Closed on
Jul 7, 2015
Sold by
Aegis Capital Markets Llc
Bought by
Mills Bros Llc
Purchase Details
Closed on
Jul 6, 2015
Sold by
Zullo Thomas A and Zullo Karen
Bought by
Aegis Capital Markets Llc
Purchase Details
Closed on
Oct 9, 2013
Sold by
Bell Andrew and Bell Joy
Bought by
Zullo Thomas A and Zullo Karen
Purchase Details
Closed on
Sep 29, 2004
Sold by
Bell Andrew
Bought by
Not Provided Joy and Bell Andrew
Create a Home Valuation Report for This Property
The Home Valuation Report is an in-depth analysis detailing your home's value as well as a comparison with similar homes in the area
Home Values in the Area
Average Home Value in this Area
Purchase History
| Date | Buyer | Sale Price | Title Company |
|---|---|---|---|
| Mills Bros Llc | $38,018 | Attorney | |
| Mills Joseph V | $19,200 | Fidelity Nat Title Ins Co | |
| Mills Bros Llc | $25,000 | Attorney | |
| Aegis Capital Markets Llc | $25,000 | Attorney | |
| Zullo Thomas A | $20,000 | Keystone Title Agency Inc | |
| Not Provided Joy | -- | -- |
Source: Public Records
Mortgage History
| Date | Status | Borrower | Loan Amount |
|---|---|---|---|
| Previous Owner | Mills Joseph V | $38,250 |
Source: Public Records
Tax History Compared to Growth
Tax History
| Year | Tax Paid | Tax Assessment Tax Assessment Total Assessment is a certain percentage of the fair market value that is determined by local assessors to be the total taxable value of land and additions on the property. | Land | Improvement |
|---|---|---|---|---|
| 2025 | $1,672 | $120,864 | $29,288 | $91,576 |
| 2024 | $1,672 | $112,068 | $24,423 | $87,645 |
| 2023 | $1,610 | $62,600 | $0 | $0 |
| 2022 | $1,316 | $94,169 | $20,361 | $73,808 |
| 2021 | $1,117 | $65,660 | $14,544 | $51,116 |
| 2020 | $955 | $47,044 | $7,021 | $40,023 |
| 2019 | $905 | $43,905 | $7,021 | $36,884 |
| 2018 | $884 | $42,550 | $7,021 | $35,529 |
| 2017 | $673 | $28,951 | $7,021 | $21,930 |
| 2016 | $630 | $28,426 | $7,021 | $21,405 |
| 2015 | $549 | $23,072 | $7,021 | $16,051 |
| 2014 | $525 | $22,655 | $7,021 | $15,634 |
Source: Public Records
Map
Nearby Homes
- 4716 Gazania St
- 4709 Gazania St
- 4713 Naftis Ln
- 4632 Salvia St
- 4622 Paloverde Dr
- 4637 Cottonwood Dr
- 4617 Cottonwood Dr
- 4707 Alma St
- 4837 Rainbow Race
- 4423 Kohler St
- 4864 Shell Stream Blvd
- 4602 Ontario Dr
- 4844 Booth Bay Dr
- 4852 Shell Stream Blvd
- 4706 Catherine St
- 4505 Cottonwood Dr
- 4479 Tucker Square
- 4462 Rudder Way
- 4845 Shell Stream Blvd
- 4921 Shell Stream Blvd
- 4602 Irene Loop
- 4546 Irene Loop
- 4626 Irene Loop
- 4628 Irene Loop
- 4624 Irene Loop
- 4604 Irene Loop
- 4540 Irene Loop
- 4553 Irene Loop
- 4630 Irene Loop
- 4601 Irene Loop
- 4622 Irene Loop
- 4547 Irene Loop Unit 2
- 4606 Irene Loop
- 4603 Irene Loop
- 4534 Irene Loop
- 4541 Irene Loop
- 4632 Irene Loop
- 4620 Irene Loop
- 4605 Irene Loop
- 4635 Irene Loop