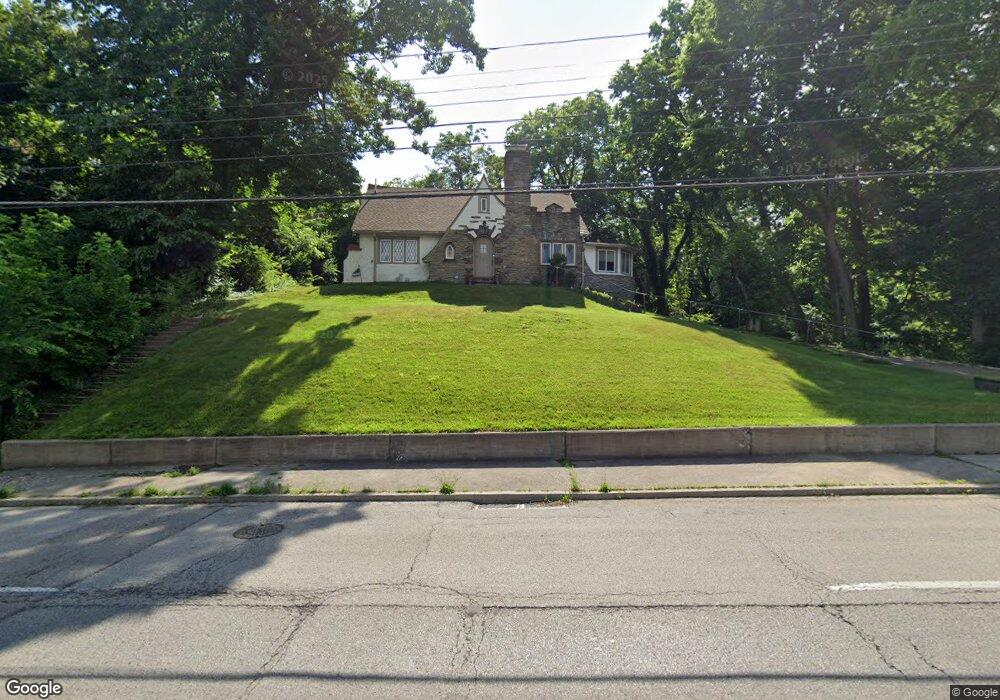
4550 Paddock Rd Cincinnati, OH 45229
Paddock Hills NeighborhoodEstimated Value: $318,957 - $395,000
4
Beds
2
Baths
2,381
Sq Ft
$151/Sq Ft
Est. Value
About This Home
This home is located at 4550 Paddock Rd, Cincinnati, OH 45229 and is currently estimated at $359,989, approximately $151 per square foot. 4550 Paddock Rd is a home located in Hamilton County with nearby schools including Bond Hill Academy Elementary School, Shroder High School, and Clark Montessori High School.
Ownership History
Date
Name
Owned For
Owner Type
Purchase Details
Closed on
Jun 10, 2014
Sold by
Taylor Soloman and Taylor Jeanette C
Bought by
Taylor Solomon and Taylor Jeannette C
Current Estimated Value
Purchase Details
Closed on
Jun 7, 2013
Sold by
Matre Kerrie K
Bought by
Miller Elissa K and 4526 Paddock Road Land Trust
Home Financials for this Owner
Home Financials are based on the most recent Mortgage that was taken out on this home.
Original Mortgage
$55,000
Interest Rate
3.38%
Mortgage Type
Future Advance Clause Open End Mortgage
Purchase Details
Closed on
May 14, 2013
Sold by
M & T Bank
Bought by
Matre Kerrie K
Home Financials for this Owner
Home Financials are based on the most recent Mortgage that was taken out on this home.
Original Mortgage
$55,000
Interest Rate
3.38%
Mortgage Type
Future Advance Clause Open End Mortgage
Create a Home Valuation Report for This Property
The Home Valuation Report is an in-depth analysis detailing your home's value as well as a comparison with similar homes in the area
Home Values in the Area
Average Home Value in this Area
Purchase History
| Date | Buyer | Sale Price | Title Company |
|---|---|---|---|
| Taylor Solomon | -- | Attorney | |
| Miller Elissa K | $30,000 | Attorney | |
| Matre Kerrie K | $17,000 | None Available |
Source: Public Records
Mortgage History
| Date | Status | Borrower | Loan Amount |
|---|---|---|---|
| Closed | Miller Elissa K | $55,000 |
Source: Public Records
Tax History
| Year | Tax Paid | Tax Assessment Tax Assessment Total Assessment is a certain percentage of the fair market value that is determined by local assessors to be the total taxable value of land and additions on the property. | Land | Improvement |
|---|---|---|---|---|
| 2025 | $4,500 | $82,947 | $22,715 | $60,232 |
| 2023 | $4,517 | $82,947 | $22,715 | $60,232 |
| 2022 | $3,193 | $55,419 | $16,870 | $38,549 |
| 2021 | $3,054 | $55,419 | $16,870 | $38,549 |
| 2020 | $3,159 | $55,419 | $16,870 | $38,549 |
| 2019 | $3,292 | $53,288 | $16,223 | $37,065 |
| 2018 | $3,298 | $53,288 | $16,223 | $37,065 |
| 2017 | $3,124 | $53,288 | $16,223 | $37,065 |
| 2016 | $3,100 | $51,822 | $17,357 | $34,465 |
| 2015 | $2,764 | $51,822 | $17,357 | $34,465 |
| 2014 | $2,785 | $51,822 | $17,357 | $34,465 |
| 2013 | $2,610 | $48,434 | $16,223 | $32,211 |
Source: Public Records
Map
Nearby Homes
- 1114 Egan Ct
- 4518 Barbara Place
- 1224 Westminster Dr
- 1266 Avon Dr
- 1284 Paddock Hills Ave
- 4900 Chalet Dr
- 4908 Chalet Dr
- 4901 Chalet Dr
- 4905 Chalet Dr
- 4903 Chalet Dr
- 1352 Westminster Dr
- 1354 Avon Dr
- 739 Betula Ave
- 741 Red Bud Ave
- 3 Baker Cir
- 710 E Ross Ave
- 5140 1/2 Imwalle Ave
- 5128 Imwalle Ave
- 1409 Yarmouth Ave
- 4009 Beechwood Ave
- 1201 Avon Dr
- 1215 Avon Dr
- 1221 Avon Dr
- 4553 Paddock Rd
- 4549 Paddock Rd
- 4559 Paddock Rd
- 4563 Paddock Rd
- 4530 Paddock Rd
- 1227 Avon Dr
- 1140 Clearbrook Dr
- 4529 Paddock Rd
- 4526 Paddock Rd
- 4571 Paddock Rd
- 1136 Clearbrook Dr
- 1233 Avon Dr
- 1143 Clearbrook Dr
- 1228 Avon Dr
- 4527 Paddock Rd
- 4564 Paddock Rd
- 0 Paddock Hills Ave Unit 1439953
Your Personal Tour Guide
Ask me questions while you tour the home.