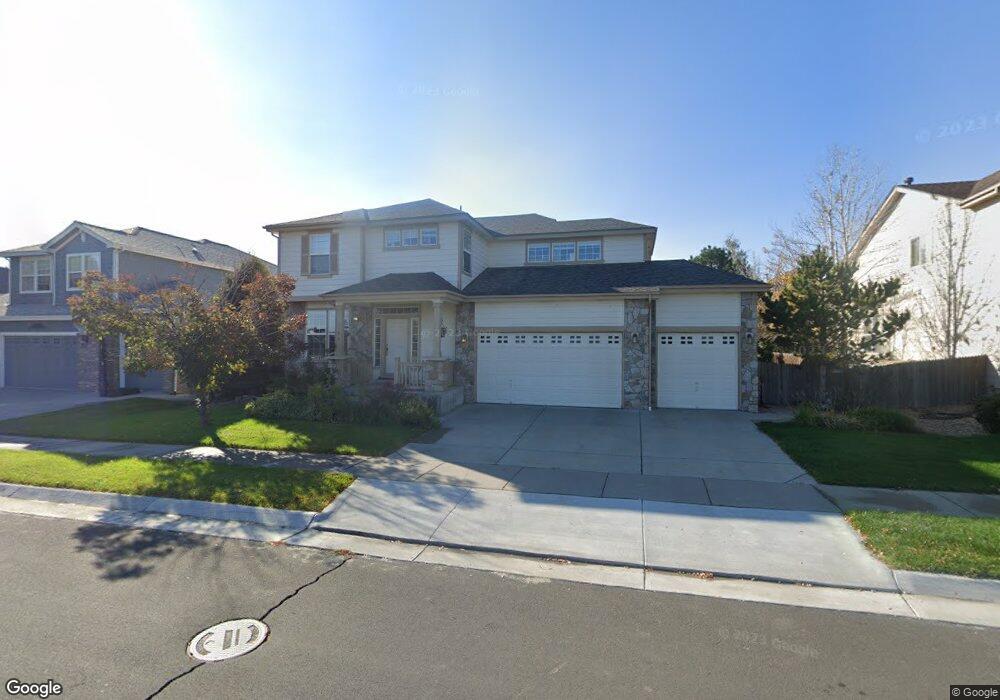
4552 Mt. Sneffels St Brighton, CO 80601
Estimated Value: $578,818 - $642,000
3
Beds
3
Baths
2,942
Sq Ft
$205/Sq Ft
Est. Value
About This Home
This home is located at 4552 Mt. Sneffels St, Brighton, CO 80601 and is currently estimated at $603,455, approximately $205 per square foot. 4552 Mt. Sneffels St is a home located in Adams County with nearby schools including Pennock Elementary School, Overland Trail Middle School, and Brighton High School.
Ownership History
Date
Name
Owned For
Owner Type
Purchase Details
Closed on
Oct 17, 2008
Sold by
Nationstar Mortgage Llc
Bought by
Mk Property Management Llc
Current Estimated Value
Home Financials for this Owner
Home Financials are based on the most recent Mortgage that was taken out on this home.
Original Mortgage
$67,600
Interest Rate
6.08%
Mortgage Type
Unknown
Purchase Details
Closed on
Jul 9, 2008
Sold by
Schuldt Ronald E and Schuldt Earla J
Bought by
Nationstar Mortgage Llc
Purchase Details
Closed on
May 20, 2005
Sold by
Centex Homes
Bought by
Schuldt Ronald E and Schuldt Earla J
Home Financials for this Owner
Home Financials are based on the most recent Mortgage that was taken out on this home.
Original Mortgage
$220,612
Interest Rate
6.6%
Mortgage Type
Fannie Mae Freddie Mac
Create a Home Valuation Report for This Property
The Home Valuation Report is an in-depth analysis detailing your home's value as well as a comparison with similar homes in the area
Home Values in the Area
Average Home Value in this Area
Purchase History
| Date | Buyer | Sale Price | Title Company |
|---|---|---|---|
| Mk Property Management Llc | $225,000 | None Available | |
| Nationstar Mortgage Llc | -- | None Available | |
| Schuldt Ronald E | $275,766 | Commerce Title |
Source: Public Records
Mortgage History
| Date | Status | Borrower | Loan Amount |
|---|---|---|---|
| Closed | Mk Property Management Llc | $67,600 | |
| Previous Owner | Schuldt Ronald E | $220,612 | |
| Closed | Schuldt Ronald E | $55,154 |
Source: Public Records
Tax History Compared to Growth
Tax History
| Year | Tax Paid | Tax Assessment Tax Assessment Total Assessment is a certain percentage of the fair market value that is determined by local assessors to be the total taxable value of land and additions on the property. | Land | Improvement |
|---|---|---|---|---|
| 2024 | $6,527 | $36,310 | $6,560 | $29,750 |
| 2023 | $6,502 | $41,880 | $6,360 | $35,520 |
| 2022 | $5,111 | $29,500 | $6,530 | $22,970 |
| 2021 | $4,927 | $29,500 | $6,530 | $22,970 |
| 2020 | $4,818 | $30,010 | $6,720 | $23,290 |
| 2019 | $4,824 | $30,010 | $6,720 | $23,290 |
| 2018 | $4,485 | $27,850 | $3,460 | $24,390 |
| 2017 | $4,489 | $27,850 | $3,460 | $24,390 |
| 2016 | $3,782 | $24,240 | $3,820 | $20,420 |
| 2015 | $3,766 | $24,240 | $3,820 | $20,420 |
| 2014 | $2,867 | $18,600 | $3,260 | $15,340 |
Source: Public Records
Map
Nearby Homes
- 4454 Mount Lincoln St
- 4314 Mount Oxford St
- 376 Lake Granby Ave
- 336 Lake Granby Ave
- 316 Lake Granby Ave
- 306 Lake Granby Ave
- 4445 Tanner Peak Trail
- 4183-60601-9 Runyon Lake St
- 4749 Mount Shavano St
- 4589 Quandary Peak St
- 4171-60602-1 Runyon Lake St
- 4171 Runyon Lake St
- 4670 Quandary Peak St
- 4165-60602-2 Runyon Lake St
- 4641 Quandary Peak St
- 4824 Mt Shavano St
- 4591 Crestone Peak St
- 19 S 45th Ave
- 4950 Mount Cameron Dr
- 4134 Grand Lake St
- 4552 Mount Sneffels St
- 4572 Mt. Sneffels St
- 4532 Mt. Sneffels St
- 4555 Mt. Princeton St
- 4565 Mt. Princeton St
- 4535 Mt. Princeton St
- 4535 Mount Princeton St
- 4582 Mt. Sneffels St
- 4522 Mt. Sneffels St
- 4565 Mt Princeton St
- 4575 Mt. Princeton St
- 4525 Mt. Princeton St
- 4525 Mt Princeton St
- 4512 Mount Sneffels St
- 4575 Mt Princeton St
- 4575 Mount Princeton St
- 4592 Mt. Sneffels St
- 4592 Mount Sneffels St
- 4512 Mt. Sneffels St
- 4515 Mt. Princeton St