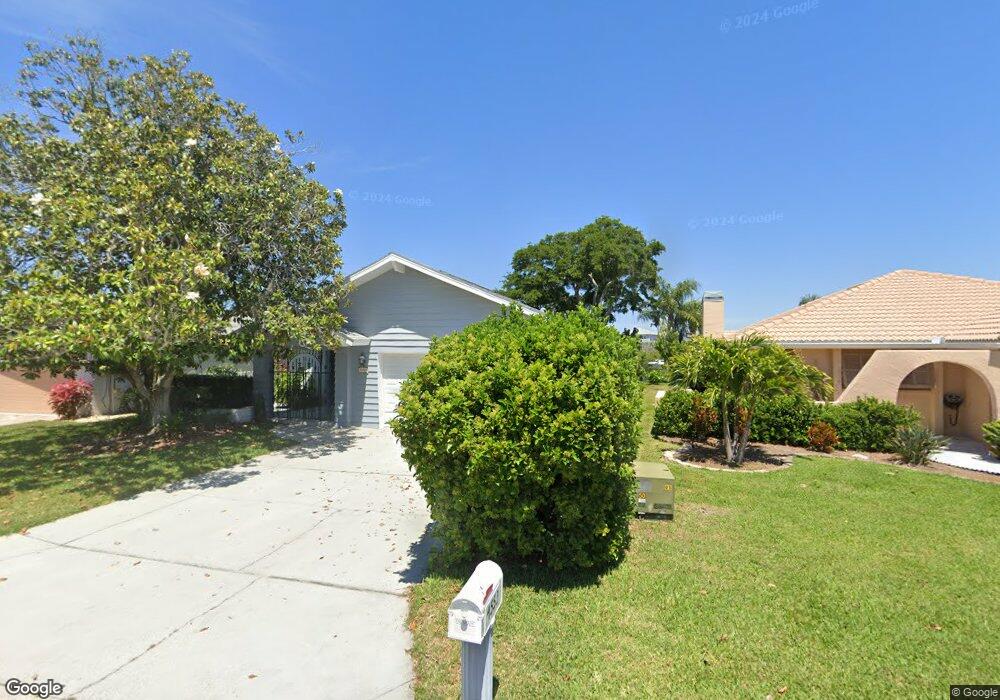
4553 Rickover Ct New Port Richey, FL 34652
Flor-A-Mar NeighborhoodEstimated Value: $380,000 - $655,000
3
Beds
2
Baths
2,595
Sq Ft
$183/Sq Ft
Est. Value
About This Home
This home is located at 4553 Rickover Ct, New Port Richey, FL 34652 and is currently estimated at $474,779, approximately $182 per square foot. 4553 Rickover Ct is a home located in Pasco County with nearby schools including Richey Elementary School, Gulf Middle School, and Gulf High School.
Ownership History
Date
Name
Owned For
Owner Type
Purchase Details
Closed on
Sep 18, 2013
Sold by
Fifth Third Mortgage Company
Bought by
Garcia Rudy D and Garcia Carolyn
Current Estimated Value
Purchase Details
Closed on
Feb 1, 2013
Sold by
Gruber Darrell G and Lazar Barbara E
Bought by
Fifth Third Mortgage Company
Purchase Details
Closed on
May 19, 2006
Sold by
Lazar Barbara E
Bought by
Lazar Barbara E and Gruber Darrell G
Home Financials for this Owner
Home Financials are based on the most recent Mortgage that was taken out on this home.
Original Mortgage
$437,250
Interest Rate
6.41%
Mortgage Type
Fannie Mae Freddie Mac
Purchase Details
Closed on
Aug 26, 1995
Sold by
Larue Robert E and Larue Dorothy W
Bought by
Lazar Barbara E
Home Financials for this Owner
Home Financials are based on the most recent Mortgage that was taken out on this home.
Original Mortgage
$133,200
Interest Rate
7.76%
Mortgage Type
Purchase Money Mortgage
Create a Home Valuation Report for This Property
The Home Valuation Report is an in-depth analysis detailing your home's value as well as a comparison with similar homes in the area
Home Values in the Area
Average Home Value in this Area
Purchase History
| Date | Buyer | Sale Price | Title Company |
|---|---|---|---|
| Garcia Rudy D | $225,000 | Servicelink | |
| Fifth Third Mortgage Company | $160,000 | Attorney | |
| Lazar Barbara E | -- | None Available | |
| Lazar Barbara E | $148,000 | -- |
Source: Public Records
Mortgage History
| Date | Status | Borrower | Loan Amount |
|---|---|---|---|
| Previous Owner | Lazar Barbara E | $437,250 | |
| Previous Owner | Lazar Barbara E | $133,200 |
Source: Public Records
Tax History Compared to Growth
Tax History
| Year | Tax Paid | Tax Assessment Tax Assessment Total Assessment is a certain percentage of the fair market value that is determined by local assessors to be the total taxable value of land and additions on the property. | Land | Improvement |
|---|---|---|---|---|
| 2025 | $8,876 | $393,506 | $216,641 | $176,865 |
| 2024 | $8,876 | $569,304 | $216,641 | $352,663 |
| 2023 | $8,079 | $431,260 | $0 | $0 |
| 2022 | $6,637 | $439,681 | $164,122 | $275,559 |
| 2021 | $5,897 | $356,424 | $131,297 | $225,127 |
| 2020 | $5,707 | $344,599 | $127,062 | $217,537 |
| 2019 | $5,515 | $344,846 | $127,062 | $217,784 |
| 2018 | $5,089 | $320,230 | $127,062 | $193,168 |
| 2017 | $4,561 | $264,502 | $127,062 | $137,440 |
| 2016 | $4,353 | $250,737 | $127,062 | $123,675 |
| 2015 | $4,297 | $242,256 | $127,062 | $115,194 |
| 2014 | $3,934 | $225,361 | $123,533 | $101,828 |
Source: Public Records
Map
Nearby Homes
- 4529 Dewey Dr
- 5627 Jobeth Dr
- 4621 Dewey Dr
- 4504 Dewey Dr
- 4451 Dewey Dr
- 5712 Biscayne Ct Unit 203
- 5712 Biscayne Ct Unit 201
- 5712 Biscayne Ct Unit 103
- 5537 Sea Forest Dr Unit 307
- 4743 Jennmar Way
- 4651 Dewey Dr
- 5722 Biscayne Ct Unit 304
- 5722 Biscayne Ct Unit 308
- 5968 Aqua Reserve Blvd
- 5557 Sea Forest Dr Unit 216
- 5557 Sea Forest Dr Unit 118
- 5557 Sea Forest Dr Unit 314
- 4516 Seagull Dr Unit 419
- 4516 Seagull Dr Unit 905
- 4516 Seagull Dr Unit 520
- 4547 Rickover Ct
- 4601 Rickover Ct
- 4541 Rickover Ct
- 4605 Rickover Ct
- 4537 Rickover Ct
- 4609 Rickover Ct
- 4554 Rickover Ct
- 4548 Rickover Ct
- 4560 Rickover Ct
- 4535 Rickover Ct
- 4540 Rickover Ct
- 4533 Rickover Ct
- 4530 Rickover Ct
- 4529 Rickover Ct
- 4522 Rickover Ct
- 4523 Rickover Ct
- 4516 Rickover Ct
- 4519 Rickover Ct
- 4510 Rickover Ct
- 4533 Dewey Dr