Estimated Value: $220,000 - $234,000
--
Bed
2
Baths
1,342
Sq Ft
$168/Sq Ft
Est. Value
About This Home
This home is located at 45542 Hidden View Ct Unit 871, 17, Utica, MI 48315 and is currently estimated at $225,384, approximately $167 per square foot. 45542 Hidden View Ct Unit 871, 17 is a home located in Macomb County with nearby schools including Flickinger Elementary School, Eppler Junior High School, and Utica High School.
Ownership History
Date
Name
Owned For
Owner Type
Purchase Details
Closed on
Jul 16, 2021
Sold by
Atanasovski Daniela
Bought by
Marsoomi Ali Al
Current Estimated Value
Purchase Details
Closed on
Aug 7, 2008
Sold by
Wells Fargo Bank Na
Bought by
Federal National Mortgage Association
Purchase Details
Closed on
Aug 1, 2008
Sold by
Genna Brad
Bought by
Wells Fargo Bank Na
Purchase Details
Closed on
Jun 30, 2005
Sold by
Pristine Properties Of Utica Llc
Bought by
Genna Brad
Home Financials for this Owner
Home Financials are based on the most recent Mortgage that was taken out on this home.
Original Mortgage
$175,200
Interest Rate
4.75%
Mortgage Type
Fannie Mae Freddie Mac
Create a Home Valuation Report for This Property
The Home Valuation Report is an in-depth analysis detailing your home's value as well as a comparison with similar homes in the area
Home Values in the Area
Average Home Value in this Area
Purchase History
| Date | Buyer | Sale Price | Title Company |
|---|---|---|---|
| Marsoomi Ali Al | $180,000 | None Available | |
| Federal National Mortgage Association | -- | None Available | |
| Wells Fargo Bank Na | $177,304 | None Available | |
| Genna Brad | $180,628 | Greco | |
| Pristine Properties Of Utica Llc | $40,000 | Greco |
Source: Public Records
Mortgage History
| Date | Status | Borrower | Loan Amount |
|---|---|---|---|
| Previous Owner | Genna Brad | $175,200 |
Source: Public Records
Tax History Compared to Growth
Tax History
| Year | Tax Paid | Tax Assessment Tax Assessment Total Assessment is a certain percentage of the fair market value that is determined by local assessors to be the total taxable value of land and additions on the property. | Land | Improvement |
|---|---|---|---|---|
| 2025 | $3,618 | $108,000 | $0 | $0 |
| 2024 | $3,329 | $105,800 | $0 | $0 |
| 2023 | $3,162 | $94,000 | $0 | $0 |
| 2022 | $3,274 | $79,800 | $0 | $0 |
| 2021 | $2,411 | $76,000 | $0 | $0 |
| 2020 | $2,252 | $73,700 | $0 | $0 |
| 2019 | $2,704 | $69,400 | $0 | $0 |
| 2018 | $2,676 | $66,400 | $0 | $0 |
| 2017 | $2,638 | $55,440 | $4,500 | $50,940 |
| 2016 | $2,607 | $55,440 | $0 | $0 |
| 2015 | -- | $48,232 | $0 | $0 |
| 2014 | -- | $41,928 | $0 | $0 |
Source: Public Records
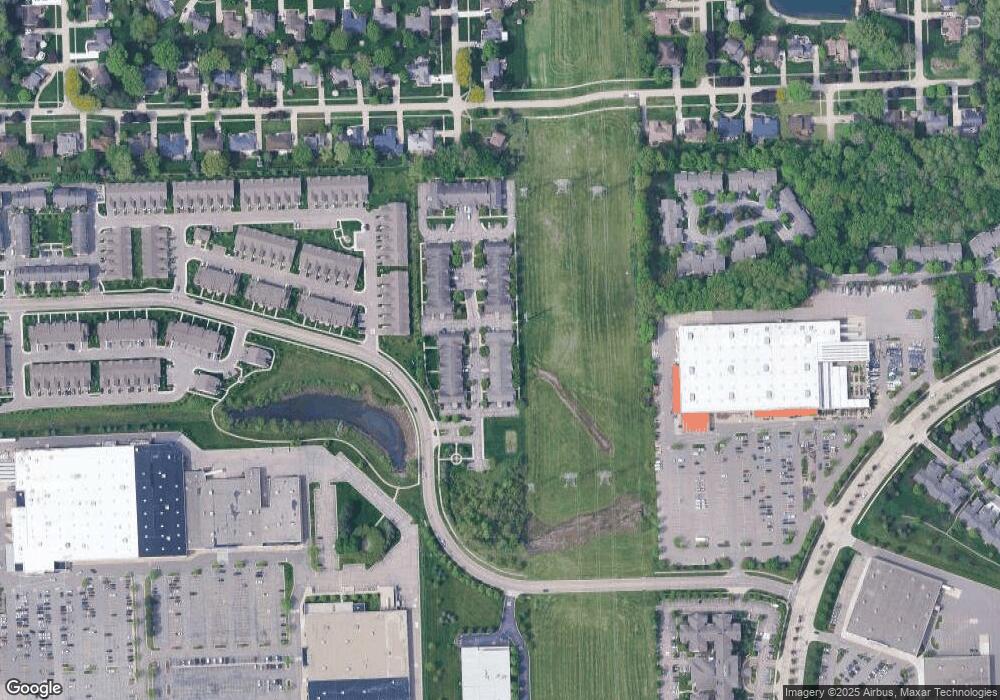
Map
Nearby Homes
- 11705 Squiers Blvd Unit 114
- 11685 Squiers Blvd Unit 95
- 56745 Spruce Forest Dr
- 45311 Kensington St
- 45745 Kensington St
- 13000 Janine Ct
- 45290 Keding St Unit 301
- 46128 Sterritt St
- 46075 Hecker Dr
- 14151 Lakeside Blvd N Unit 46
- 44361 Mathison Dr
- 44205 Felstone Dr
- 11027 Russell St
- 12115 Canal Rd
- 8919 Janis St
- 45089 Klingkammer St Unit 10
- 13199 Hazelnut Dr Unit 27
- 11420 Canal Rd Unit 202
- 13370 Forest Ridge Blvd Unit 172
- 12862 Beechnut Dr
- 45556 Hidden View Ct Unit 30
- 45546 Hidden View Ct Unit 29
- 45530 Hidden View Ct Unit 28
- 45532 Hidden View Ct Unit 27
- 45536 Hidden View Ct Unit 26
- 45544 Hidden View Ct Unit 25
- 45554 Hidden View Ct Unit 24
- 45558 Hidden View Ct Unit 23
- 45552 Hidden View Ct Unit 22
- 45548 Hidden View Ct Unit 21
- 45538 Hidden View Ct Unit 20
- 45534 Hidden View Ct Unit 19
- 45540 Hidden View Ct Unit 18
- 45542 Hidden View Ct Unit 17
- 45550 Hidden View Ct Unit 16
- 12123 Hidden View Ct Unit 2
- 45547 Hidden View Ct Unit 44
- 45531 Hidden View Ct Unit 43
- 45545 Hidden View Ct Unit 40
- 45555 Hidden View Ct Unit 39