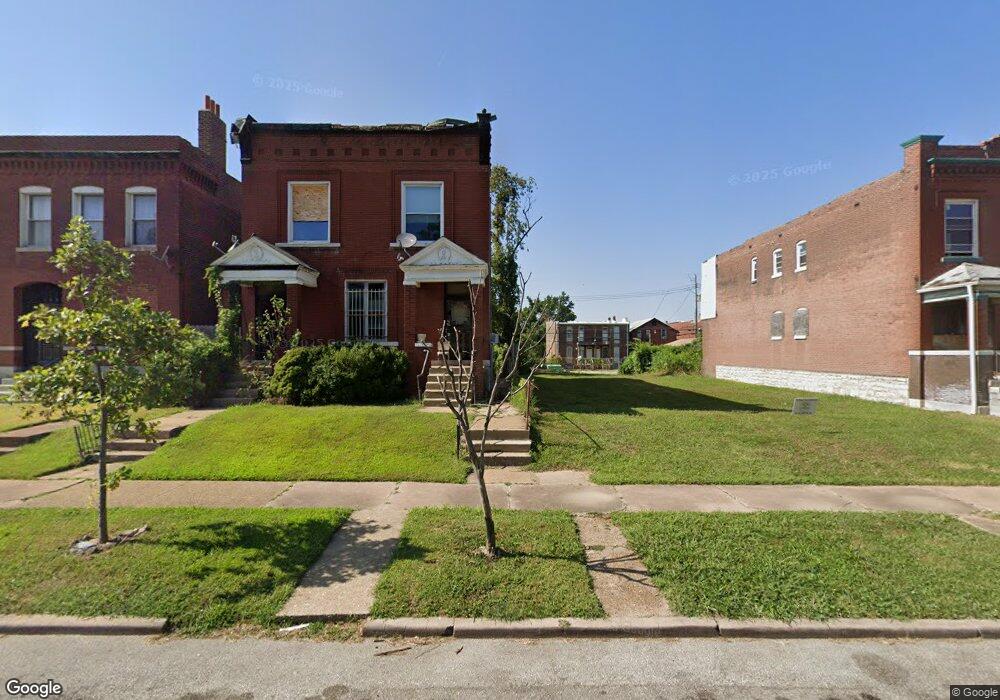
4555 Clarence Ave Saint Louis, MO 63115
O'Fallon NeighborhoodEstimated Value: $53,000 - $95,000
--
Bed
2
Baths
3,052
Sq Ft
$25/Sq Ft
Est. Value
About This Home
This home is located at 4555 Clarence Ave, Saint Louis, MO 63115 and is currently estimated at $75,888, approximately $24 per square foot. 4555 Clarence Ave is a home located in St. Louis City with nearby schools including Hickey Elementary School, Yeatman-Liddell Middle School, and Vashon High School.
Ownership History
Date
Name
Owned For
Owner Type
Purchase Details
Closed on
Apr 25, 2019
Sold by
Young Roy E and Young Kathy M
Bought by
Woffard Leodis
Current Estimated Value
Home Financials for this Owner
Home Financials are based on the most recent Mortgage that was taken out on this home.
Original Mortgage
$51,075
Outstanding Balance
$44,904
Interest Rate
4.3%
Mortgage Type
VA
Estimated Equity
$30,984
Purchase Details
Closed on
May 23, 2005
Sold by
Love Christopher Brian
Bought by
Young Roy E and Young Kathy M
Home Financials for this Owner
Home Financials are based on the most recent Mortgage that was taken out on this home.
Original Mortgage
$47,500
Interest Rate
5.83%
Mortgage Type
Fannie Mae Freddie Mac
Purchase Details
Closed on
Feb 4, 1997
Sold by
Love Christopher Brian
Bought by
Love Christopher Brian and Christopher Brian Love Revocable Living
Create a Home Valuation Report for This Property
The Home Valuation Report is an in-depth analysis detailing your home's value as well as a comparison with similar homes in the area
Home Values in the Area
Average Home Value in this Area
Purchase History
| Date | Buyer | Sale Price | Title Company |
|---|---|---|---|
| Woffard Leodis | $50,000 | None Available | |
| Young Roy E | -- | U S Title | |
| Love Christopher Brian | -- | -- |
Source: Public Records
Mortgage History
| Date | Status | Borrower | Loan Amount |
|---|---|---|---|
| Open | Woffard Leodis | $51,075 | |
| Previous Owner | Young Roy E | $47,500 |
Source: Public Records
Tax History Compared to Growth
Tax History
| Year | Tax Paid | Tax Assessment Tax Assessment Total Assessment is a certain percentage of the fair market value that is determined by local assessors to be the total taxable value of land and additions on the property. | Land | Improvement |
|---|---|---|---|---|
| 2025 | $324 | $3,660 | $480 | $3,180 |
| 2024 | $310 | $3,540 | $480 | $3,060 |
| 2023 | $310 | $3,540 | $480 | $3,060 |
| 2022 | $316 | $3,480 | $480 | $3,000 |
| 2021 | $315 | $3,480 | $480 | $3,000 |
| 2020 | $313 | $3,480 | $480 | $3,000 |
| 2019 | $312 | $3,480 | $480 | $3,000 |
| 2018 | $308 | $3,330 | $480 | $2,850 |
| 2017 | $304 | $3,330 | $480 | $2,850 |
| 2016 | $401 | $4,450 | $890 | $3,550 |
| 2015 | $366 | $4,440 | $890 | $3,550 |
| 2014 | $409 | $4,440 | $890 | $3,550 |
| 2013 | -- | $5,010 | $890 | $4,120 |
Source: Public Records
Map
Nearby Homes
- 4537 Clarence Ave
- 4648 Pope Ave
- 4535 Holly Ave
- 4610 Pope Ave
- 4608 Pope Ave
- 4454 Holly Ave
- 4450 Holly Ave
- 4419 Holly Ave
- 4402 Clarence Ave
- 4253 Holly Ave
- 4210 E Carter Ave
- 4237 Holly Ave
- 4219 Red Bud Ave
- 4449 Anderson Ave
- 4418 Dryden Ave
- 4550 Adelaide Ave
- 4224 Penrose St
- 4680 W Florissant Ave
- 4627 Korte Ave
- 4477 Bessie Ave
- 4557 Clarence Ave
- 4549 Clarence Ave
- 4561 Clarence Ave
- 4547 Clarence Ave
- 4565 Clarence Ave
- 4543 Clarence Ave
- 4539 Clarence Ave
- 4567 Clarence Ave
- 4654 Pope Ave
- 4658 Pope Ave
- 4571 Clarence Ave
- 4660 Pope Ave
- 4644 Pope Ave
- 4664 Pope Ave
- 4552 Clarence Ave
- 4556 Clarence Ave
- 4533 Clarence Ave
- 4548 Clarence Ave
- 4642 Pope Ave
- 4560 Clarence Ave