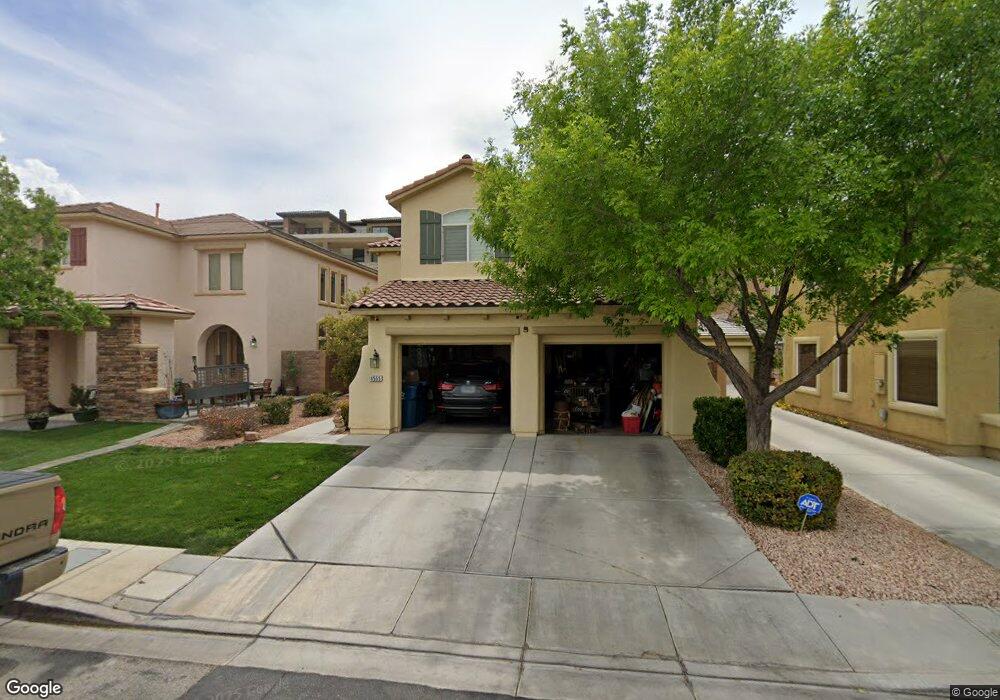
4555 Weitzman Place Unit 2 Las Vegas, NV 89141
Southern Highlands NeighborhoodEstimated Value: $602,000 - $667,000
4
Beds
3
Baths
2,656
Sq Ft
$237/Sq Ft
Est. Value
About This Home
This home is located at 4555 Weitzman Place Unit 2, Las Vegas, NV 89141 and is currently estimated at $628,496, approximately $236 per square foot. 4555 Weitzman Place Unit 2 is a home located in Clark County with nearby schools including Evelyn Stuckey Elementary School, Lois & Jerry Tarkanian Middle School, and Desert Oasis High School.
Ownership History
Date
Name
Owned For
Owner Type
Purchase Details
Closed on
Dec 17, 2015
Sold by
Greystone Nevada Llc
Bought by
Scott David S and Scott Aoi H
Current Estimated Value
Home Financials for this Owner
Home Financials are based on the most recent Mortgage that was taken out on this home.
Original Mortgage
$417,000
Outstanding Balance
$330,543
Interest Rate
3.94%
Mortgage Type
VA
Estimated Equity
$297,953
Purchase Details
Closed on
May 30, 2003
Sold by
Pn Ii Inc
Bought by
Morrissey Michael W and Morrisey Teresa Hui Mei Liang
Home Financials for this Owner
Home Financials are based on the most recent Mortgage that was taken out on this home.
Original Mortgage
$223,480
Interest Rate
5.75%
Mortgage Type
Unknown
Create a Home Valuation Report for This Property
The Home Valuation Report is an in-depth analysis detailing your home's value as well as a comparison with similar homes in the area
Home Values in the Area
Average Home Value in this Area
Purchase History
| Date | Buyer | Sale Price | Title Company |
|---|---|---|---|
| Scott David S | -- | Stewart Title Company | |
| Morrissey Michael W | $279,350 | Lawyers Title Of Nevada |
Source: Public Records
Mortgage History
| Date | Status | Borrower | Loan Amount |
|---|---|---|---|
| Open | Scott David S | $417,000 | |
| Previous Owner | Morrissey Michael W | $223,480 |
Source: Public Records
Tax History Compared to Growth
Tax History
| Year | Tax Paid | Tax Assessment Tax Assessment Total Assessment is a certain percentage of the fair market value that is determined by local assessors to be the total taxable value of land and additions on the property. | Land | Improvement |
|---|---|---|---|---|
| 2025 | $2,768 | $168,222 | $50,750 | $117,472 |
| 2024 | $2,674 | $168,222 | $50,750 | $117,472 |
| 2023 | $2,674 | $150,512 | $39,900 | $110,612 |
| 2022 | $2,596 | $136,279 | $35,000 | $101,279 |
| 2021 | $2,521 | $125,542 | $29,400 | $96,142 |
| 2020 | $2,444 | $123,561 | $28,350 | $95,211 |
| 2019 | $2,373 | $120,499 | $26,950 | $93,549 |
| 2018 | $2,304 | $110,050 | $20,300 | $89,750 |
| 2017 | $3,296 | $112,369 | $21,350 | $91,019 |
| 2016 | $2,182 | $101,127 | $15,750 | $85,377 |
| 2015 | $2,178 | $81,395 | $12,250 | $69,145 |
| 2014 | $2,114 | $70,433 | $10,500 | $59,933 |
Source: Public Records
Map
Nearby Homes
- 11152 San Terrazo Place
- 4509 Melrose Abbey Place
- 11186 Villa Bellagio Dr
- 11132 Ferragamo Ct
- 11005 Inverlochy Ct
- 11150 Coco Ln
- 4327 Melrose Abbey Place
- 11063 Gagliano St
- 11197 Piazzale St
- 11021 Royal Highlands St
- 4419 Via Bianca Ave
- 4723 Visconti Way
- 10825 Bernini Dr
- 4708 Peacock Cliffs Ave
- 3953 Painted Lady Ave
- 10273 Fragrant Apple Ct
- 4133 Golden Fleece Ave
- 3922 Painted Lady Ave
- 11148 Star Lily St
- 11226 Star Lily St
- 4561 Weitzman Place
- 4549 Weitzman Place
- 4567 Weitzman Place
- 4543 Weitzman Place
- 4573 Weitzman Place
- 4537 Weitzman Place
- 11107 Oleg Ct Unit 2
- 11106 Mezlan Ln
- 11116 Villa Bellagio Dr
- 4579 Weitzman Place
- 4531 Weitzman Place
- 11103 Oleg Ct Unit 2
- 11126 Villa Bellagio Dr
- 11102 Mezlan Ln
- 4585 Weitzman Place
- 4525 Weitzman Place
- 4525 Weitzman Place Unit n/a
- 11108 Oleg Ct Unit 2
- 11136 Villa Bellagio Dr
- 4589 Weitzman Place