Estimated payment $1,764/month
Highlights
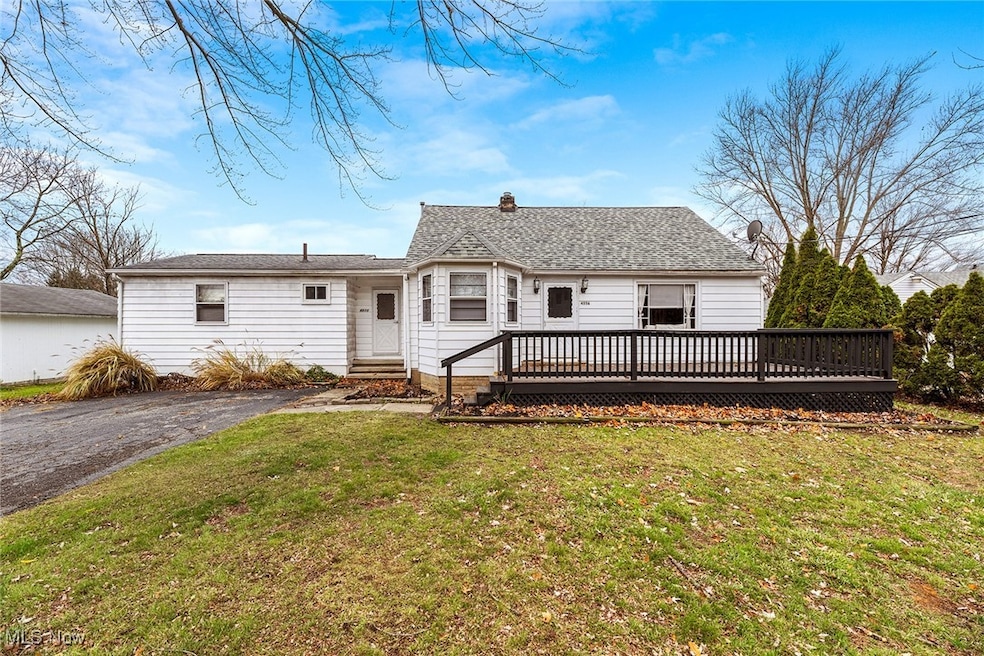
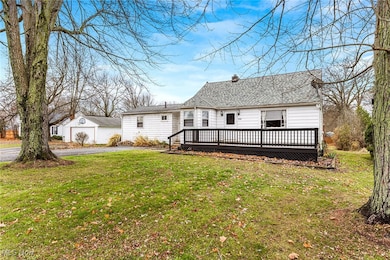
- Cape Cod Architecture
- No HOA
- Forced Air Heating and Cooling System
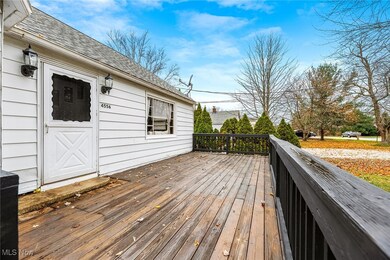
- Deck
- 2 Car Detached Garage
About This Home
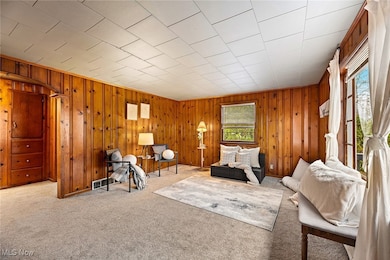
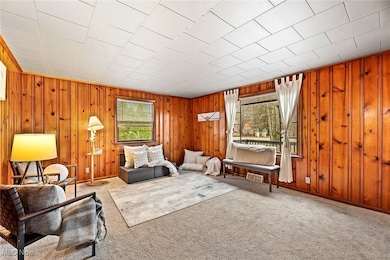
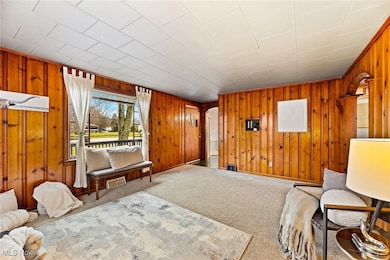
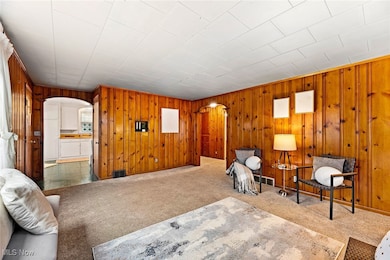
Unique cape cod style home with a full attached mother in law suite! This charming home features a spacious eat in kitchen, a large and sunny living room with knotty pine walls and 2 main floor bedrooms plus a full bath. Upstairs you'll enjoy a very large bedroom and a multi purpose room perfect for a walk in closet, play room or nursery. Attached through the shared breezeway is a full MIL suite with its own kitchen, living room with sliders to the back yard, bedroom and bath. MIL suite has separately zoned heat and AC, and separately metered water gas and electric. Huge 2 car garage with plenty of parking and a spacious yard.
Listing Agent
Keller Williams Chervenic Rlty Brokerage Email: kellywiseproperties@gmail.com, 330-907-4100 License #2010001173 Listed on: 11/28/2025

Home Details
Home Type
- Single Family
Est. Annual Taxes
- $4,735
Year Built
- Built in 1953
Parking
- 2 Car Detached Garage
Home Design
- Cape Cod Architecture
- Fiberglass Roof
- Asphalt Roof
- Aluminum Siding
Interior Spaces
- 1,666 Sq Ft Home
- 2-Story Property
- Basement Fills Entire Space Under The House
Bedrooms and Bathrooms
- 4 Bedrooms | 3 Main Level Bedrooms
- 2 Full Bathrooms
Utilities
- Forced Air Heating and Cooling System
- Heating System Uses Gas
Additional Features
- Deck
- 0.61 Acre Lot
Community Details
- No Home Owners Association
Listing and Financial Details
- Assessor Parcel Number 5603891
Map
Home Values in the Area
Average Home Value in this Area
Tax History
| Year | Tax Paid | Tax Assessment Tax Assessment Total Assessment is a certain percentage of the fair market value that is determined by local assessors to be the total taxable value of land and additions on the property. | Land | Improvement |
|---|---|---|---|---|
| 2025 | $4,587 | $79,961 | $19,138 | $60,823 |
| 2024 | $4,587 | $79,961 | $19,138 | $60,823 |
| 2023 | $4,587 | $79,961 | $19,138 | $60,823 |
| 2022 | $3,962 | $60,743 | $14,389 | $46,354 |
| 2021 | $3,556 | $60,743 | $14,389 | $46,354 |
| 2020 | $3,496 | $60,740 | $14,390 | $46,350 |
| 2019 | $3,028 | $48,870 | $14,390 | $34,480 |
| 2018 | $2,980 | $48,870 | $14,390 | $34,480 |
| 2017 | $2,884 | $48,870 | $14,390 | $34,480 |
| 2016 | $2,965 | $45,900 | $14,390 | $31,510 |
| 2015 | $2,884 | $45,900 | $14,390 | $31,510 |
| 2014 | $2,886 | $45,900 | $14,390 | $31,510 |
| 2013 | $3,068 | $49,260 | $14,390 | $34,870 |
Property History
| Date | Event | Price | List to Sale | Price per Sq Ft |
|---|---|---|---|---|
| 11/28/2025 11/28/25 | For Sale | $260,000 | -- | $156 / Sq Ft |
Purchase History
| Date | Type | Sale Price | Title Company |
|---|---|---|---|
| Deed | -- | Chicago Title | |
| Certificate Of Transfer | -- | None Available | |
| Survivorship Deed | $114,000 | Village Title Agency | |
| Warranty Deed | $114,000 | Endress Title Company Inc |
Mortgage History
| Date | Status | Loan Amount | Loan Type |
|---|---|---|---|
| Previous Owner | $91,200 | No Value Available | |
| Previous Owner | $91,200 | No Value Available |
Source: MLS Now
MLS Number: 5174670
APN: 56-03891
Disclaimer: Certain information contained herein is derived from information provided by parties other than Homes.com. All information provided is deemed reliable, but is not guaranteed to be accurate and should be independently verified.
![]() IDX information is provided exclusively for personal, non-commercial use, and may not be used for any purpose other than to identify prospective properties consumers may be interested in purchasing. Information is deemed reliable but not guaranteed.
IDX information is provided exclusively for personal, non-commercial use, and may not be used for any purpose other than to identify prospective properties consumers may be interested in purchasing. Information is deemed reliable but not guaranteed.
- 4444 Hickory Trail
- 2714 Wexford Blvd
- 4155 Burton Dr
- 4131 Burton Dr
- 4638 Dresher Trail
- 2831 Saybrooke Blvd
- 4078 Pardee Rd
- 2908 Wexford Blvd
- 4901 Independence Cir Unit B
- 2410 Wrens Dr S
- 4916 Friar Rd Unit B
- 4221 Bunker Ln
- 2215 Lynnwood Dr
- 0 Vira Rd
- 3982 Baird Rd
- 4120 Klein Ave
- 4944 Friar Rd Unit D
- 0 Stow Rd Unit 5102979
- 2380 Port Williams Dr Unit 2380
- 3869 Lake Run Blvd
- 4392 Millburn Ave
- 2530 Colony Park Place
- 2855-2875 Graham Rd
- 2390 Wrens Cir
- 3780 Osage St
- 3946 Fishcreek Rd
- 4320 Mannington Blvd
- 4287 Kent Rd
- 3674 Kent Rd
- 3625 Kent Rd Unit 3
- 4376 Darrow Rd Unit 6
- 3603 Kent Rd Unit 3
- 1941 Hidden Lake Dr
- 900 Bart Ln
- 1200 Spruce Ct
- 4707 Kent Rd Unit 1-4
- 1313 W Main St
- 5659 Humelsine Dr
- 1493-1501 Mac Dr
- 200 Spaulding Dr