4557 Metro Ct Annandale, VA 22003
Estimated Value: $545,000 - $594,000
3
Beds
4
Baths
1,400
Sq Ft
$406/Sq Ft
Est. Value
About This Home
This home is located at 4557 Metro Ct, Annandale, VA 22003 and is currently estimated at $567,815, approximately $405 per square foot. 4557 Metro Ct is a home located in Fairfax County with nearby schools including Annandale Terrace Elementary School, Poe Middle School, and Annandale High School.
Ownership History
Date
Name
Owned For
Owner Type
Purchase Details
Closed on
Dec 6, 2018
Sold by
Karabelas Sandy K and The Sandy K Karabelas Trust
Bought by
Karabelas Sandy K and The Sandy K Karabelas Trust
Current Estimated Value
Home Financials for this Owner
Home Financials are based on the most recent Mortgage that was taken out on this home.
Original Mortgage
$194,400
Outstanding Balance
$171,271
Interest Rate
4.8%
Mortgage Type
New Conventional
Estimated Equity
$396,544
Purchase Details
Closed on
Oct 6, 2016
Sold by
Karabelas Sandy K
Bought by
Sandy L Karabelas Trust Dated The 6Th Da
Purchase Details
Closed on
Jul 16, 2004
Sold by
Bassin David C
Bought by
Karabelas Sandy K
Home Financials for this Owner
Home Financials are based on the most recent Mortgage that was taken out on this home.
Original Mortgage
$276,000
Interest Rate
6.25%
Mortgage Type
New Conventional
Create a Home Valuation Report for This Property
The Home Valuation Report is an in-depth analysis detailing your home's value as well as a comparison with similar homes in the area
Home Values in the Area
Average Home Value in this Area
Purchase History
| Date | Buyer | Sale Price | Title Company |
|---|---|---|---|
| Karabelas Sandy K | -- | Masters Title & Escrow | |
| Sandy L Karabelas Trust Dated The 6Th Da | -- | None Available | |
| Karabelas Sandy K | $345,000 | -- |
Source: Public Records
Mortgage History
| Date | Status | Borrower | Loan Amount |
|---|---|---|---|
| Open | Karabelas Sandy K | $194,400 | |
| Previous Owner | Karabelas Sandy K | $276,000 |
Source: Public Records
Tax History Compared to Growth
Tax History
| Year | Tax Paid | Tax Assessment Tax Assessment Total Assessment is a certain percentage of the fair market value that is determined by local assessors to be the total taxable value of land and additions on the property. | Land | Improvement |
|---|---|---|---|---|
| 2025 | $5,443 | $520,520 | $165,000 | $355,520 |
| 2024 | $5,443 | $469,800 | $150,000 | $319,800 |
| 2023 | $5,270 | $466,980 | $150,000 | $316,980 |
| 2022 | $5,189 | $453,750 | $145,000 | $308,750 |
| 2021 | $4,697 | $400,270 | $125,000 | $275,270 |
| 2020 | $4,737 | $400,270 | $125,000 | $275,270 |
| 2019 | $4,535 | $383,220 | $120,000 | $263,220 |
| 2018 | $4,094 | $356,000 | $110,000 | $246,000 |
| 2017 | $4,133 | $356,000 | $110,000 | $246,000 |
| 2016 | $3,952 | $341,140 | $103,000 | $238,140 |
| 2015 | $3,722 | $333,470 | $100,000 | $233,470 |
| 2014 | $3,489 | $313,320 | $91,000 | $222,320 |
Source: Public Records
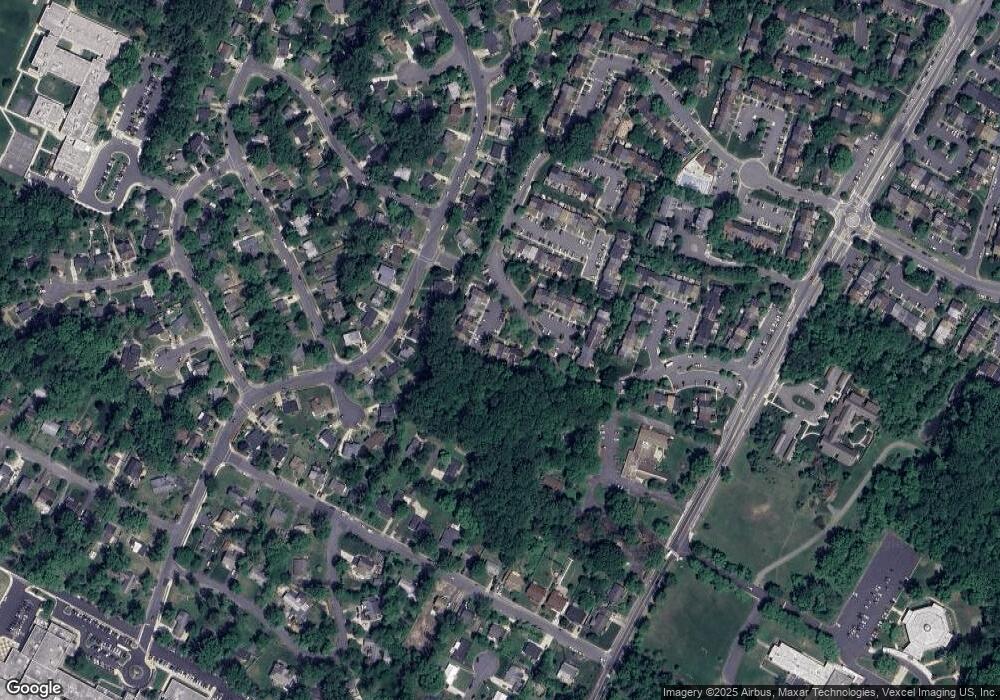
Map
Nearby Homes
- 4536 Garbo Ct
- 4541 Garbo Ct
- 7602 Gaylord Dr
- 4722 Bristow Dr
- 7324 Auburn St
- 7711 Lafayette Forest Dr Unit 22
- 7209 Sipes Ln
- 4917 Erie St
- 4227 Americana Dr Unit 102
- 7113 Falcon St
- 4017 Woodland Rd
- 4333 Americana Dr Unit 203
- 5005 Ravensworth Rd
- 7900 Inverton Rd Unit 3
- 4367 Americana Dr Unit 104
- 4068H Championship Dr
- 4408 Island Place Unit 202
- 7313 Byrneley Ln
- 7905 Dassett Ct Unit 304
- 7052 Wardell St
- 4555 Metro Ct
- 4559 Metro Ct
- 4553 Metro Ct
- 4551 Metro Ct
- 4564 Metro Ct
- 4562 Metro Ct
- 4560 Metro Ct
- 4566 Metro Ct
- 4558 Metro Ct
- 4556 Metro Ct
- 4554 Metro Ct
- 4552 Metro Ct
- 4550 Metro Ct
- 4521 Casablanca Ct
- 4523 Casablanca Ct
- 4525 Casablanca Ct
- 4527 Casablanca Ct
- 4503 Medford Dr
- 4505 Medford Dr
- 4529 Casablanca Ct