Estimated Value: $351,000 - $400,000
4
Beds
2
Baths
1,600
Sq Ft
$239/Sq Ft
Est. Value
About This Home
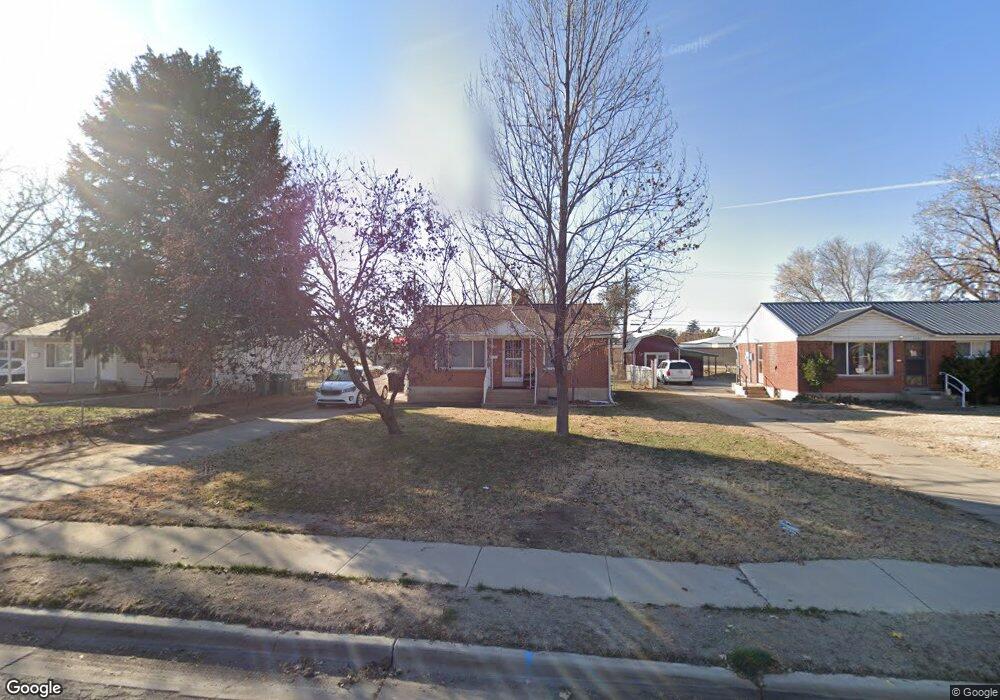
This home is located at 4557 S 2350 W, Roy, UT 84067 and is currently estimated at $382,262, approximately $238 per square foot. 4557 S 2350 W is a home located in Weber County with nearby schools including Valley View School, Sand Ridge Junior High School, and Roy High School.
Ownership History
Date
Name
Owned For
Owner Type
Purchase Details
Closed on
Oct 29, 2018
Sold by
Frost Randie
Bought by
Baugh Anthony Michael and Baugh Bunnylyn Metran
Current Estimated Value
Home Financials for this Owner
Home Financials are based on the most recent Mortgage that was taken out on this home.
Original Mortgage
$11,000
Outstanding Balance
$9,633
Interest Rate
4.6%
Mortgage Type
Stand Alone Second
Estimated Equity
$372,629
Purchase Details
Closed on
Jan 23, 2014
Sold by
Bowers Randall D and Bowers Leeann H
Bought by
Frost Randie
Home Financials for this Owner
Home Financials are based on the most recent Mortgage that was taken out on this home.
Original Mortgage
$123,520
Interest Rate
4.25%
Mortgage Type
FHA
Purchase Details
Closed on
Apr 10, 2003
Sold by
Patton Don K and Patton Valeria
Bought by
Patton Don K and Patton Valerie
Create a Home Valuation Report for This Property
The Home Valuation Report is an in-depth analysis detailing your home's value as well as a comparison with similar homes in the area
Home Values in the Area
Average Home Value in this Area
Purchase History
| Date | Buyer | Sale Price | Title Company |
|---|---|---|---|
| Baugh Anthony Michael | -- | Synergy Title Ins Agcy Ll | |
| Frost Randie | -- | Us Title Ins Agency | |
| Patton Don K | -- | Bonneville Title |
Source: Public Records
Mortgage History
| Date | Status | Borrower | Loan Amount |
|---|---|---|---|
| Open | Baugh Anthony Michael | $11,000 | |
| Previous Owner | Frost Randie | $123,520 |
Source: Public Records
Tax History
| Year | Tax Paid | Tax Assessment Tax Assessment Total Assessment is a certain percentage of the fair market value that is determined by local assessors to be the total taxable value of land and additions on the property. | Land | Improvement |
|---|---|---|---|---|
| 2025 | $2,189 | $339,349 | $120,000 | $219,349 |
| 2024 | $2,139 | $183,699 | $66,000 | $117,699 |
| 2023 | $1,942 | $165,550 | $63,153 | $102,397 |
| 2022 | $2,203 | $196,900 | $55,002 | $141,898 |
| 2021 | $1,798 | $263,000 | $70,019 | $192,981 |
| 2020 | $1,577 | $210,000 | $70,019 | $139,981 |
| 2019 | $1,568 | $197,000 | $40,016 | $156,984 |
| 2018 | $1,455 | $171,000 | $36,029 | $134,971 |
| 2017 | $1,313 | $143,000 | $36,029 | $106,971 |
| 2016 | $1,231 | $71,627 | $19,021 | $52,606 |
| 2015 | $1,105 | $65,099 | $19,021 | $46,078 |
| 2014 | $968 | $54,884 | $16,160 | $38,724 |
Source: Public Records
Map
Nearby Homes
Your Personal Tour Guide
Ask me questions while you tour the home.