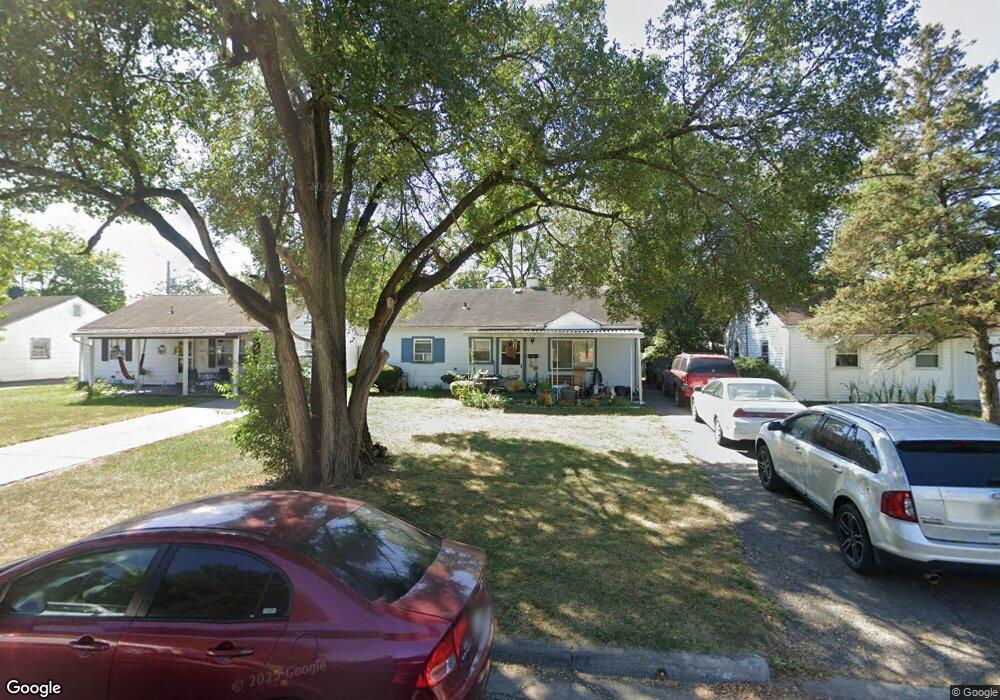
4557 Saint Francis Ln Columbus, OH 43213
Estimated Value: $157,000 - $187,000
3
Beds
1
Bath
875
Sq Ft
$197/Sq Ft
Est. Value
About This Home
This home is located at 4557 Saint Francis Ln, Columbus, OH 43213 and is currently estimated at $172,309, approximately $196 per square foot. 4557 Saint Francis Ln is a home located in Franklin County with nearby schools including Etna Road Elementary School, Beechwood Elementary School, and Rosemore Middle School.
Ownership History
Date
Name
Owned For
Owner Type
Purchase Details
Closed on
Aug 4, 2006
Sold by
Koepplin Martha and Koepplin Norman R
Bought by
Hoy Connie R
Current Estimated Value
Home Financials for this Owner
Home Financials are based on the most recent Mortgage that was taken out on this home.
Original Mortgage
$32,750
Interest Rate
6.85%
Mortgage Type
Purchase Money Mortgage
Purchase Details
Closed on
Apr 14, 2006
Sold by
Hoy Connie
Bought by
Koepplin Martha
Purchase Details
Closed on
Oct 14, 2005
Sold by
Koepplin Norman R and Koepplin Martha W
Bought by
Hoy Connie
Purchase Details
Closed on
Jul 10, 1997
Sold by
Koepplin Norman R and Koepplin Martha W
Bought by
Koepplin Norman R and Koepplin Martha W
Purchase Details
Closed on
Jul 11, 1990
Purchase Details
Closed on
Nov 20, 1989
Create a Home Valuation Report for This Property
The Home Valuation Report is an in-depth analysis detailing your home's value as well as a comparison with similar homes in the area
Home Values in the Area
Average Home Value in this Area
Purchase History
| Date | Buyer | Sale Price | Title Company |
|---|---|---|---|
| Hoy Connie R | -- | Title First | |
| Koepplin Martha | -- | None Available | |
| Hoy Connie | -- | -- | |
| Koepplin Norman R | -- | -- | |
| Koepplin Norman R | -- | -- | |
| -- | -- | -- | |
| -- | -- | -- |
Source: Public Records
Mortgage History
| Date | Status | Borrower | Loan Amount |
|---|---|---|---|
| Closed | Hoy Connie R | $32,750 |
Source: Public Records
Tax History Compared to Growth
Tax History
| Year | Tax Paid | Tax Assessment Tax Assessment Total Assessment is a certain percentage of the fair market value that is determined by local assessors to be the total taxable value of land and additions on the property. | Land | Improvement |
|---|---|---|---|---|
| 2024 | $1,471 | $43,440 | $13,090 | $30,350 |
| 2023 | $1,487 | $43,435 | $13,090 | $30,345 |
| 2022 | $1,598 | $27,970 | $5,040 | $22,930 |
| 2021 | $1,500 | $27,970 | $5,040 | $22,930 |
| 2020 | $1,485 | $27,970 | $5,040 | $22,930 |
| 2019 | $1,396 | $22,860 | $4,030 | $18,830 |
| 2018 | $1,266 | $22,860 | $4,030 | $18,830 |
| 2017 | $1,224 | $22,860 | $4,030 | $18,830 |
| 2016 | $1,100 | $16,840 | $4,100 | $12,740 |
| 2015 | $1,109 | $16,840 | $4,100 | $12,740 |
| 2014 | $1,110 | $16,840 | $4,100 | $12,740 |
| 2013 | $586 | $18,690 | $4,550 | $14,140 |
Source: Public Records
Map
Nearby Homes
- 4489 Saint Margaret Ln
- 4368 Broadhurst Dr
- 4232 Mayflower Blvd
- 451 Beaver Ave
- 353 Shell Ct E
- 571 S Hamilton Rd
- 4148 Elbern Ave
- 424 Cumberland Dr
- 469 Cumberland Dr
- 322 Fairway Cir
- 579 Westphal Ave
- 4780 Etna Rd Unit 782
- 4653 Kae Ave
- 91 Robinwood Ave
- 547 Country Club Rd
- 4662 Jae Ave
- 110 Ironclad Dr Unit 9
- 3814 Elbern Ave
- 185 Prairiecreek Way Unit 185
- 798 S Yearling Rd
- 4549 Saint Francis Ln
- 4563 Saint Francis Ln
- 4543 Saint Francis Ln
- 4569 Saint Francis Ln
- 4558 Norton Ln
- 4564 Norton Ln
- 4552 Norton Ln
- 4546 Norton Ln
- 4572 Norton Ln
- 4537 Saint Francis Ln
- 4575 Saint Francis Ln
- 4575 St Francis Ln
- 4564 Saint Francis Ln
- 4556 Saint Francis Ln
- 4572 Saint Francis Ln
- 4540 Norton Ln
- 4580 Norton Ln
- 4548 Saint Francis Ln
- 4583 Saint Francis Ln
- 4529 Saint Francis Ln