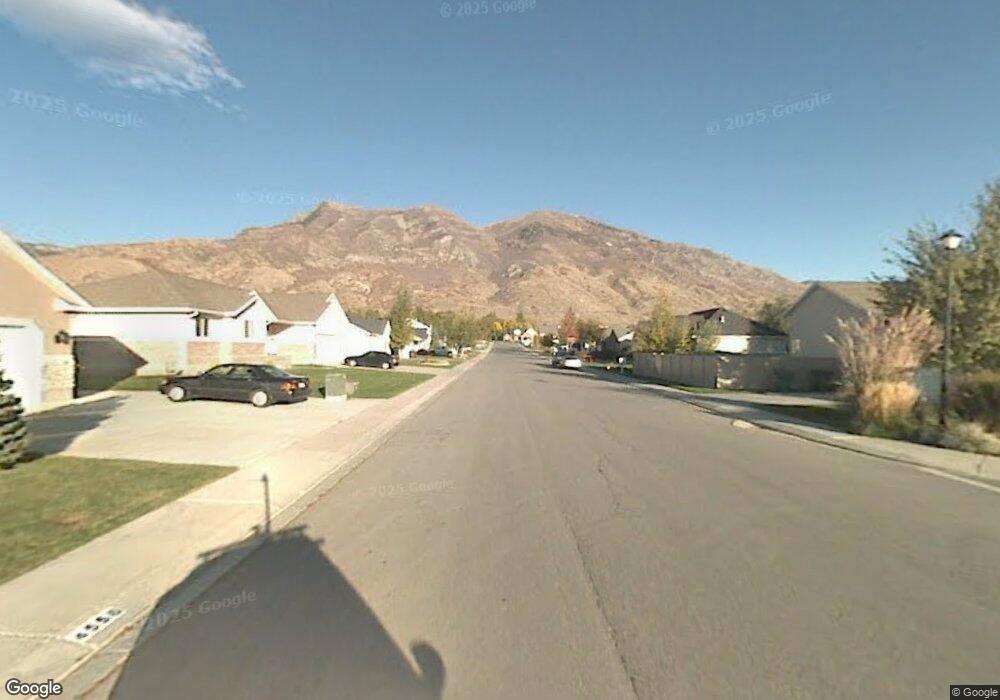
4558 W 9980 N Pleasant Grove, UT 84062
Estimated Value: $623,000 - $689,000
3
Beds
3
Baths
3,540
Sq Ft
$185/Sq Ft
Est. Value
About This Home
This home is located at 4558 W 9980 N, Pleasant Grove, UT 84062 and is currently estimated at $656,656, approximately $185 per square foot. 4558 W 9980 N is a home located in Utah County with nearby schools including Cedar Ridge Elementary School, Mountain Ridge Junior High School, and Lone Peak High School.
Ownership History
Date
Name
Owned For
Owner Type
Purchase Details
Closed on
Dec 30, 2016
Sold by
Klemin Jeff M
Bought by
Klemin Jeff M and Klemin Vivian M
Current Estimated Value
Home Financials for this Owner
Home Financials are based on the most recent Mortgage that was taken out on this home.
Original Mortgage
$244,500
Outstanding Balance
$200,971
Interest Rate
4.03%
Mortgage Type
New Conventional
Estimated Equity
$455,685
Purchase Details
Closed on
Jul 5, 2006
Sold by
Klemin Jeffrey M
Bought by
Klemin Jeffrey M and Klemin Vivian M
Purchase Details
Closed on
Jul 23, 1998
Sold by
Heiser Allen J and Heiser Dalice L
Bought by
Wilson Dean E and Wilson Darlene W
Purchase Details
Closed on
Jun 27, 1997
Sold by
G & G Investments L C
Bought by
Heiser Allen J and Heiser Dalice L
Home Financials for this Owner
Home Financials are based on the most recent Mortgage that was taken out on this home.
Original Mortgage
$168,450
Interest Rate
7.92%
Mortgage Type
Construction
Create a Home Valuation Report for This Property
The Home Valuation Report is an in-depth analysis detailing your home's value as well as a comparison with similar homes in the area
Home Values in the Area
Average Home Value in this Area
Purchase History
| Date | Buyer | Sale Price | Title Company |
|---|---|---|---|
| Klemin Jeff M | -- | Gt Title Services | |
| Klemin Jeff M | -- | Gt Title Services | |
| Klemin Jeffrey M | -- | Bartlett Title Insurance Ag | |
| Wilson Dean E | -- | First American Title | |
| Heiser Allen J | -- | Stewart Title Guaranty Compa |
Source: Public Records
Mortgage History
| Date | Status | Borrower | Loan Amount |
|---|---|---|---|
| Open | Klemin Jeff M | $244,500 | |
| Previous Owner | Heiser Allen J | $168,450 |
Source: Public Records
Tax History Compared to Growth
Tax History
| Year | Tax Paid | Tax Assessment Tax Assessment Total Assessment is a certain percentage of the fair market value that is determined by local assessors to be the total taxable value of land and additions on the property. | Land | Improvement |
|---|---|---|---|---|
| 2025 | $2,482 | $318,725 | $244,800 | $334,700 |
| 2024 | $2,482 | $293,920 | $0 | $0 |
| 2023 | $2,280 | $290,070 | $0 | $0 |
| 2022 | $2,428 | $301,785 | $0 | $0 |
| 2021 | $2,167 | $401,100 | $148,500 | $252,600 |
| 2020 | $2,021 | $365,100 | $137,500 | $227,600 |
| 2019 | $1,849 | $346,800 | $130,300 | $216,500 |
| 2018 | $1,796 | $317,500 | $123,000 | $194,500 |
| 2017 | $1,742 | $164,670 | $0 | $0 |
| 2016 | $1,611 | $141,625 | $0 | $0 |
| 2015 | $1,688 | $140,415 | $0 | $0 |
| 2014 | $1,593 | $131,670 | $0 | $0 |
Source: Public Records
Map
Nearby Homes
- 10052 N Marigold Ln
- 4696 W Camellia Ln
- 4616 W Carriage Ln
- 4811 Pocosin Ct
- 4812 W Pocosin Ct
- 4812 Pocosin Ct
- 4821 W Pocosin Ct Unit 751
- 4631 W Harvey Blvd
- 4816 Pocosin Ct
- 4816 W Pocosin Ct
- 4822 W Pocosin Ct
- 10207 N Cottonwood Dr
- 10087 N Torreya Dr Unit 728
- 10022 N Loblobby Ln Unit 713
- 9681 N Peach Ct
- 10088 N Loblobby Ln
- 9900 N Meadow Dr
- 4198 W Sage Rd N
- 9857 N Featherstone Dr
- 4924 Willowstone Dr
- 4542 W 9980 N
- 4572 W 9980 N
- 9968 N 4560 W
- 9969 N 4560 W
- 4586 W 9980 N
- 4528 W 9980 N
- 4531 W 9980 N
- 4585 W 9980 N
- 9955 N 4560 W
- 4548 W Spring Cir
- 4512 W 9980 N
- 4532 W Spring Cir
- 9956 N 4600 W
- 4515 W 9980 N
- 9890 N 4560 W Unit 16
- 9939 N 4560 W
- 4610 W 9980 N
- 10002 Buttercup Ln
- 10006 Buttercup Ln
- 4520 W Spring Cir