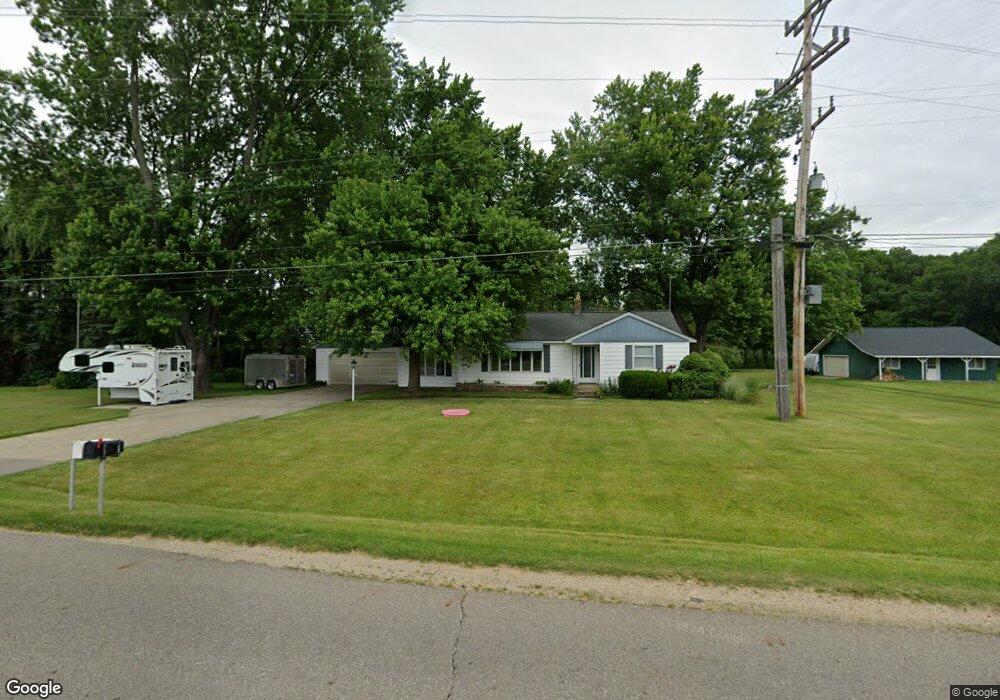
4559 137th Ave Hamilton, MI 49419
Estimated Value: $411,000 - $461,000
3
Beds
2
Baths
1,192
Sq Ft
$368/Sq Ft
Est. Value
About This Home
This home is located at 4559 137th Ave, Hamilton, MI 49419 and is currently estimated at $439,004, approximately $368 per square foot. 4559 137th Ave is a home located in Allegan County with nearby schools including Hamilton High School.
Ownership History
Date
Name
Owned For
Owner Type
Purchase Details
Closed on
Sep 16, 2022
Sold by
Lyn Compagner Tyler
Bought by
Zvonek Steven L and Zvonek Lelia A
Current Estimated Value
Home Financials for this Owner
Home Financials are based on the most recent Mortgage that was taken out on this home.
Original Mortgage
$272,000
Outstanding Balance
$259,313
Interest Rate
4.99%
Mortgage Type
New Conventional
Estimated Equity
$179,691
Purchase Details
Closed on
Aug 11, 2009
Sold by
Nyboer Garry
Bought by
Compagner Thomas L and Compagner Sharon J
Home Financials for this Owner
Home Financials are based on the most recent Mortgage that was taken out on this home.
Original Mortgage
$105,000
Interest Rate
5.62%
Mortgage Type
Purchase Money Mortgage
Purchase Details
Closed on
Jun 22, 2009
Sold by
Nyboer Garry
Bought by
Compagner Tyler Lyn
Home Financials for this Owner
Home Financials are based on the most recent Mortgage that was taken out on this home.
Original Mortgage
$105,000
Interest Rate
5.62%
Mortgage Type
Purchase Money Mortgage
Create a Home Valuation Report for This Property
The Home Valuation Report is an in-depth analysis detailing your home's value as well as a comparison with similar homes in the area
Purchase History
| Date | Buyer | Sale Price | Title Company |
|---|---|---|---|
| Zvonek Steven L | $390,000 | Chicago Title | |
| Compagner Thomas L | $105,000 | None Available | |
| Compagner Tyler Lyn | $115,000 | First American Title Ins Co |
Source: Public Records
Mortgage History
| Date | Status | Borrower | Loan Amount |
|---|---|---|---|
| Open | Zvonek Steven L | $272,000 | |
| Previous Owner | Compagner Tyler Lyn | $105,000 |
Source: Public Records
Tax History
| Year | Tax Paid | Tax Assessment Tax Assessment Total Assessment is a certain percentage of the fair market value that is determined by local assessors to be the total taxable value of land and additions on the property. | Land | Improvement |
|---|---|---|---|---|
| 2025 | $5,597 | $173,200 | $46,000 | $127,200 |
| 2024 | -- | $161,800 | $36,500 | $125,300 |
| 2023 | $4,513 | $150,700 | $34,800 | $115,900 |
| 2022 | $3,195 | $124,900 | $24,600 | $100,300 |
| 2021 | $3,046 | $114,100 | $24,100 | $90,000 |
| 2020 | $2,955 | $116,500 | $24,100 | $92,400 |
| 2019 | $2,884 | $112,000 | $21,600 | $90,400 |
| 2018 | $2,773 | $97,500 | $19,800 | $77,700 |
| 2017 | $0 | $97,000 | $19,800 | $77,200 |
| 2016 | $0 | $82,400 | $16,000 | $66,400 |
| 2015 | -- | $82,400 | $16,000 | $66,400 |
| 2014 | -- | $81,100 | $15,400 | $65,700 |
| 2013 | -- | $77,600 | $15,400 | $62,200 |
Source: Public Records
Map
Nearby Homes
- 4672 Martin St
- 4525 135th Ave
- 4421 135th Ave
- 4498 Meadow Pond Way Unit 66
- 4494 Meadow Pond Way Unit 68
- 3590 Brook Point Dr
- 3459 44th St
- 3560 Woodfield Ct
- 4958 136th Ave
- 3249 Centennial Oak Dr
- 4143 Fillmore Rd
- 3481 Jeffrey Spur
- 4144 Spring Meadow Dr
- 4618 44th St
- 883 Main St
- 857 Winchester St
- 834 Winchester St
- Parcel 7 40th St
- 5257 146th Ave
- VL 57th St
- 4559 137th Ave
- 4556 137th Ave
- 4530 137th Ave
- 4595 137th Ave
- 0 36th St Unit 71002807465
- 0 36th St Unit 71002807462
- 0 8 Pine Ridge Trail Unit 71019052851
- 0 5 Pine Ridge Trail Unit 71019052843
- 0 1 Pine Ridge Trail Unit 71019052824
- 0 Whiperwill Lane Lake Unit 65015039099
- 0 4 Pine Ridge Trail Unit 71019052840
- 0 2 Pine Ridge Trail Unit 71019052831
- Parcel B 134th Ave
- Parcel AB 134th Ave
- 0 Whiperwill Lane Lake Unit M15039099
- 0 36th St Unit M15063514
- 0 36th St Unit M18006741
- 0 Oakdale Dr Unit M19035200
- 0 Glenwood Ln Unit M19046154
- 0 8 Pine Ridge Trail Unit M19052851
Your Personal Tour Guide
Ask me questions while you tour the home.