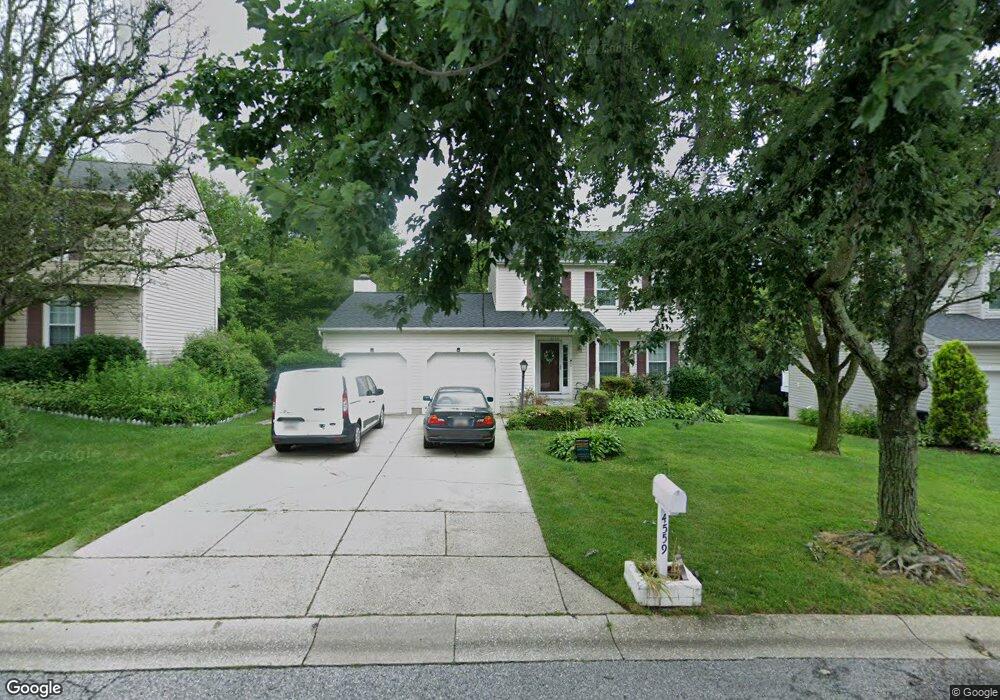
4559 Rolling Meadows Rd Ellicott City, MD 21043
Estimated Value: $657,635 - $736,000
Studio
4
Baths
1,564
Sq Ft
$444/Sq Ft
Est. Value
About This Home
This home is located at 4559 Rolling Meadows Rd, Ellicott City, MD 21043 and is currently estimated at $694,409, approximately $443 per square foot. 4559 Rolling Meadows Rd is a home located in Howard County with nearby schools including Veterans Elementary School, Ellicott Mills Middle School, and Centennial High School.
Ownership History
Date
Name
Owned For
Owner Type
Purchase Details
Closed on
Jun 16, 2010
Sold by
Platt Micahel
Bought by
Pongchit Sai and Pongchit Rosa Maria
Current Estimated Value
Home Financials for this Owner
Home Financials are based on the most recent Mortgage that was taken out on this home.
Original Mortgage
$450,927
Outstanding Balance
$309,960
Interest Rate
5.5%
Mortgage Type
FHA
Estimated Equity
$384,449
Purchase Details
Closed on
Nov 16, 1992
Sold by
Bergin Edward P
Bought by
Platt Michael
Home Financials for this Owner
Home Financials are based on the most recent Mortgage that was taken out on this home.
Original Mortgage
$165,300
Interest Rate
8.32%
Purchase Details
Closed on
Feb 27, 1989
Sold by
Ryland Group Inc The
Bought by
Bergin Edward P
Home Financials for this Owner
Home Financials are based on the most recent Mortgage that was taken out on this home.
Original Mortgage
$139,100
Interest Rate
10.78%
Create a Home Valuation Report for This Property
The Home Valuation Report is an in-depth analysis detailing your home's value as well as a comparison with similar homes in the area
Home Values in the Area
Average Home Value in this Area
Purchase History
| Date | Buyer | Sale Price | Title Company |
|---|---|---|---|
| Pongchit Sai | $457,000 | -- | |
| Platt Michael | $174,000 | -- | |
| Bergin Edward P | $154,600 | -- |
Source: Public Records
Mortgage History
| Date | Status | Borrower | Loan Amount |
|---|---|---|---|
| Open | Pongchit Sai | $450,927 | |
| Previous Owner | Platt Michael | $165,300 | |
| Previous Owner | Bergin Edward P | $139,100 |
Source: Public Records
Tax History
| Year | Tax Paid | Tax Assessment Tax Assessment Total Assessment is a certain percentage of the fair market value that is determined by local assessors to be the total taxable value of land and additions on the property. | Land | Improvement |
|---|---|---|---|---|
| 2025 | $7,476 | $520,500 | $0 | $0 |
| 2024 | $7,476 | $485,100 | $0 | $0 |
| 2023 | $6,872 | $449,700 | $247,100 | $202,600 |
| 2022 | $6,617 | $434,767 | $0 | $0 |
| 2021 | $6,188 | $419,833 | $0 | $0 |
| 2020 | $6,188 | $404,900 | $181,500 | $223,400 |
| 2019 | $6,117 | $399,967 | $0 | $0 |
| 2018 | $5,849 | $395,033 | $0 | $0 |
| 2017 | $5,761 | $390,100 | $0 | $0 |
| 2016 | -- | $386,233 | $0 | $0 |
| 2015 | -- | $382,367 | $0 | $0 |
| 2014 | -- | $378,500 | $0 | $0 |
Source: Public Records
Map
Nearby Homes
- 4510 Ashley Ct
- 8456 Roberts Rd
- 8901 Brauerton Rd Unit 301
- 8800 Bosley Rd Unit 401
- 8734 Wethered Dr
- 8507 Timber Pine Ct
- 4940 Lee Farm Ct
- 0 Hale Haven Dr
- 8556 Dina Ln Unit 41
- 4356 Columbia Rd
- 4709 Hale Haven Dr
- 8525 Trail View Dr
- 4918 Evening Sky Ct
- 8834 Goose Landing Cir
- 4179 Lotus Cir Unit 57
- 8811 Goose Landing Cir
- 4851 Ellicott Woods Ln
- 9221 Spring Valley Rd
- 8325 Grove Angle Rd
- 9233 Spring Valley Rd
- 4559 Rolling Meadows
- 4563 Rolling Meadows
- 4555 Rolling Meadows
- 4551 Rolling Meadows
- 4567 Rolling Meadows
- 4558 Rolling Meadows
- 4562 Rolling Meadows
- 4554 Rolling Meadows
- 4547 Rolling Meadows
- 4571 Rolling Meadows Rd
- 4571 Rolling Meadows
- 4550 Rolling Meadows
- 4543 Rolling Meadows
- 4509 Rusty Gate
- 4505 Rusty Gate
- 4575 Rolling Meadows
- 4570 Rolling Meadows
- 4540 Rolling Meadows
- 4513 Rusty Gate
- 8585 Harvest View Ct
Your Personal Tour Guide
Ask me questions while you tour the home.