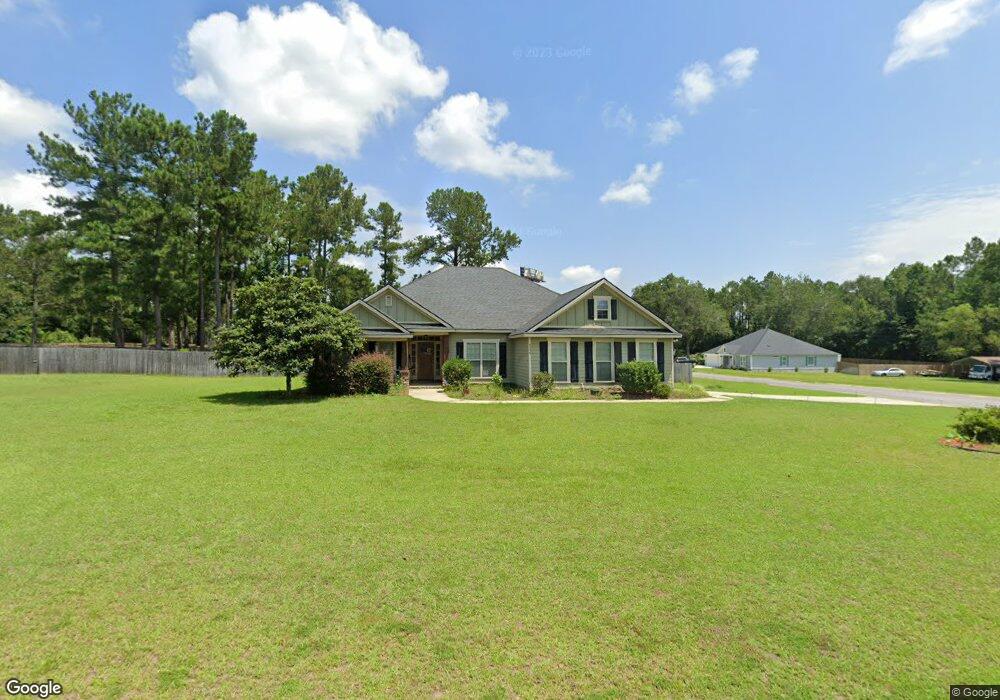
4559 Torree Pines Ln Lake Park, GA 31636
Estimated Value: $324,129 - $367,000
3
Beds
3
Baths
2,094
Sq Ft
$163/Sq Ft
Est. Value
About This Home
This home is located at 4559 Torree Pines Ln, Lake Park, GA 31636 and is currently estimated at $341,782, approximately $163 per square foot. 4559 Torree Pines Ln is a home located in Lowndes County with nearby schools including Lake Park Elementary School, Lowndes Middle School, and Lowndes High School.
Ownership History
Date
Name
Owned For
Owner Type
Purchase Details
Closed on
Jun 21, 2018
Sold by
Fountain Justin D
Bought by
Williams Christopher L
Current Estimated Value
Home Financials for this Owner
Home Financials are based on the most recent Mortgage that was taken out on this home.
Original Mortgage
$214,412
Outstanding Balance
$185,846
Interest Rate
4.6%
Mortgage Type
VA
Estimated Equity
$155,936
Purchase Details
Closed on
Sep 24, 2013
Sold by
Dennis Grimsley Construction
Bought by
Fountain Justin D and Fountain April L
Home Financials for this Owner
Home Financials are based on the most recent Mortgage that was taken out on this home.
Original Mortgage
$171,900
Interest Rate
4%
Mortgage Type
New Conventional
Purchase Details
Closed on
May 16, 2013
Sold by
Ridge Place Llc
Bought by
Dennis Grimsley Construction I
Purchase Details
Closed on
Jul 28, 2010
Sold by
Pinebrook Ii Llc
Bought by
Ridge Place Llc
Purchase Details
Closed on
Dec 8, 2006
Bought by
Pinebrook Ii Llc
Create a Home Valuation Report for This Property
The Home Valuation Report is an in-depth analysis detailing your home's value as well as a comparison with similar homes in the area
Home Values in the Area
Average Home Value in this Area
Purchase History
| Date | Buyer | Sale Price | Title Company |
|---|---|---|---|
| Williams Christopher L | $209,900 | -- | |
| Fountain Justin D | $191,000 | -- | |
| Dennis Grimsley Construction I | $73,500 | -- | |
| Ridge Place Llc | -- | -- | |
| Pinebrook Ii Llc | -- | -- |
Source: Public Records
Mortgage History
| Date | Status | Borrower | Loan Amount |
|---|---|---|---|
| Open | Williams Christopher L | $214,412 | |
| Previous Owner | Fountain Justin D | $171,900 |
Source: Public Records
Tax History Compared to Growth
Tax History
| Year | Tax Paid | Tax Assessment Tax Assessment Total Assessment is a certain percentage of the fair market value that is determined by local assessors to be the total taxable value of land and additions on the property. | Land | Improvement |
|---|---|---|---|---|
| 2024 | $2,692 | $112,823 | $9,800 | $103,023 |
| 2023 | $2,692 | $112,823 | $9,800 | $103,023 |
| 2022 | $2,312 | $82,918 | $9,800 | $73,118 |
| 2021 | $2,015 | $69,208 | $9,800 | $59,408 |
| 2020 | $1,871 | $69,208 | $9,800 | $59,408 |
| 2019 | $1,891 | $69,208 | $9,800 | $59,408 |
| 2018 | $1,745 | $69,208 | $9,800 | $59,408 |
| 2017 | $1,774 | $69,208 | $9,800 | $59,408 |
| 2016 | $1,778 | $69,208 | $9,800 | $59,408 |
| 2015 | $1,347 | $55,960 | $9,800 | $46,160 |
| 2014 | $1,375 | $9,800 | $9,800 | $0 |
Source: Public Records
Map
Nearby Homes
- 4575 Firestone Ln
- 4569 Firestone Ln
- 4701 Forrest Oak Ln
- 4737 Forrest Oak Ln
- 4517 Water Oak Trail
- 4800 Old Valdosta Bellville Rd
- 5016 Hammock Trail
- 5000 Carriage Dr
- 5064 Hammock Trail
- 5054 Hammock Trail
- 4956 Princess Dr
- 5019 Carriage Dr
- 5528 Acacia Place
- 5108 Grand Oak Cir
- 4845 Smokey Ln
- 5192 Grand Oak Cir
- 5050 Diamond Dr
- 5388 Moss Oak Trail
- 5318 Mimosa Cir
- 4940 Diamond Dr
- 4588 Firestone Ln
- 4551 Torree Pines Ln
- 4567 Torree Pines Ln
- 4582 Firestone Ln
- 4558 Torree Pines Ln
- 4550 Torree Pines Ln
- 4550 Torree Pines Ln
- 4589 Firestone Ln
- 4566 Torree Pines Ln
- 4573 Torree Pines Ln
- 4585 Firestone Ln Unit 33
- 4585 Firestone Ln
- 4581 Firestone Ln
- 4581 Firestone Ln Unit 32
- 4581 Firestone Ln
- 4604 Firestone Ln
- 4572 Torree Pines Ln Unit 30
- 4572 Torree Pines Ln Unit 22
- 4575 Firestone Ln Unit 31
- 4568 Firestone Ln