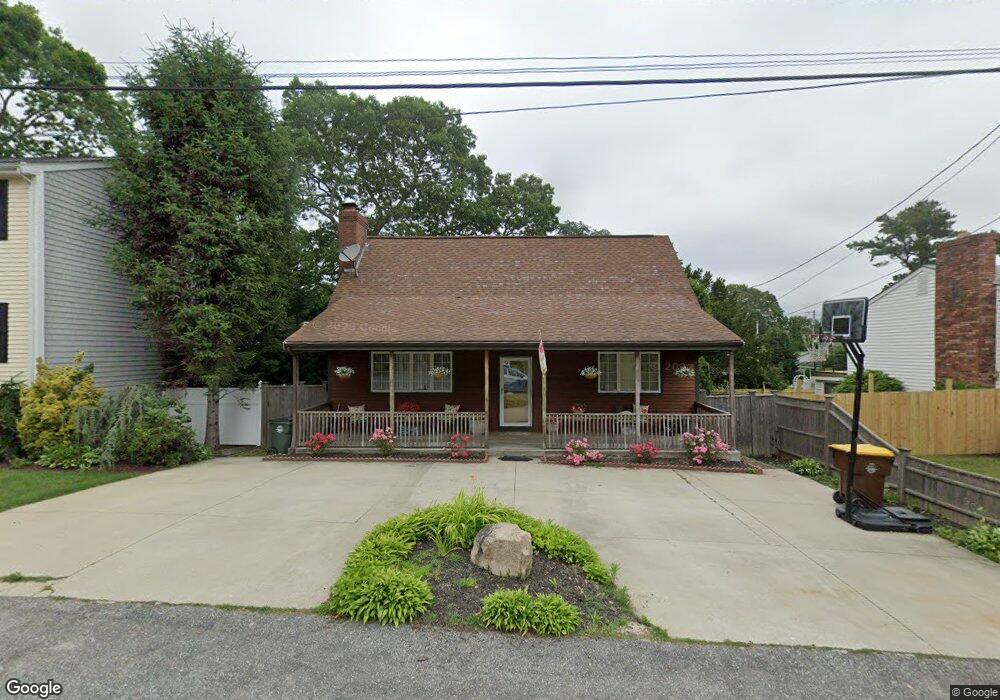
456 Bullock St Fall River, MA 02720
Bank Street NeighborhoodEstimated Value: $468,000 - $550,000
3
Beds
2
Baths
2,066
Sq Ft
$243/Sq Ft
Est. Value
About This Home
This home is located at 456 Bullock St, Fall River, MA 02720 and is currently estimated at $502,572, approximately $243 per square foot. 456 Bullock St is a home located in Bristol County with nearby schools including Mary Fonseca Elementary School, Talbot Innovation School, and B M C Durfee High School.
Ownership History
Date
Name
Owned For
Owner Type
Purchase Details
Closed on
Aug 27, 2003
Sold by
Ouellette Denise C
Bought by
Amaral Derek and Amaral Diane
Current Estimated Value
Home Financials for this Owner
Home Financials are based on the most recent Mortgage that was taken out on this home.
Original Mortgage
$256,400
Interest Rate
5.69%
Mortgage Type
Purchase Money Mortgage
Purchase Details
Closed on
Sep 1, 1999
Sold by
Baker Stephanie M
Bought by
Ouellette Denise C
Purchase Details
Closed on
Nov 30, 1989
Sold by
Maillous Roland
Bought by
Baker Stephanie M
Create a Home Valuation Report for This Property
The Home Valuation Report is an in-depth analysis detailing your home's value as well as a comparison with similar homes in the area
Home Values in the Area
Average Home Value in this Area
Purchase History
| Date | Buyer | Sale Price | Title Company |
|---|---|---|---|
| Amaral Derek | $269,900 | -- | |
| Ouellette Denise C | $139,000 | -- | |
| Baker Stephanie M | $38,000 | -- |
Source: Public Records
Mortgage History
| Date | Status | Borrower | Loan Amount |
|---|---|---|---|
| Open | Baker Stephanie M | $243,441 | |
| Closed | Baker Stephanie M | $256,400 | |
| Previous Owner | Baker Stephanie M | $14,000 |
Source: Public Records
Tax History Compared to Growth
Tax History
| Year | Tax Paid | Tax Assessment Tax Assessment Total Assessment is a certain percentage of the fair market value that is determined by local assessors to be the total taxable value of land and additions on the property. | Land | Improvement |
|---|---|---|---|---|
| 2025 | $5,044 | $440,500 | $132,200 | $308,300 |
| 2024 | $4,755 | $413,800 | $127,100 | $286,700 |
| 2023 | $4,798 | $391,000 | $114,100 | $276,900 |
| 2022 | $4,263 | $337,800 | $105,600 | $232,200 |
| 2021 | $4,301 | $311,000 | $99,700 | $211,300 |
| 2020 | $4,011 | $277,600 | $96,000 | $181,600 |
| 2019 | $3,961 | $271,700 | $96,000 | $175,700 |
| 2018 | $3,801 | $260,000 | $96,000 | $164,000 |
| 2017 | $3,599 | $257,100 | $96,000 | $161,100 |
| 2016 | $3,391 | $248,800 | $96,000 | $152,800 |
| 2015 | $3,227 | $246,700 | $89,800 | $156,900 |
| 2014 | $3,103 | $246,700 | $89,800 | $156,900 |
Source: Public Records
Map
Nearby Homes
- 168 Windsor St
- 44 Fenmore St
- 1796 Locust St
- 200 David St
- 350 Doherty St
- 36 Fordney St
- 235 Chavenson St
- 302 Oak Grove Ave
- 243 Oak Grove Ave
- 380 Eddy St
- 344 Beattie St Unit 5
- 108 Garden St
- 14 Downing St
- 23 Lexington St
- 1268 President Ave
- 159 Covel St
- 270 Garden St
- 218 Plain St
- 992 Pine St
- 49 Farnham St