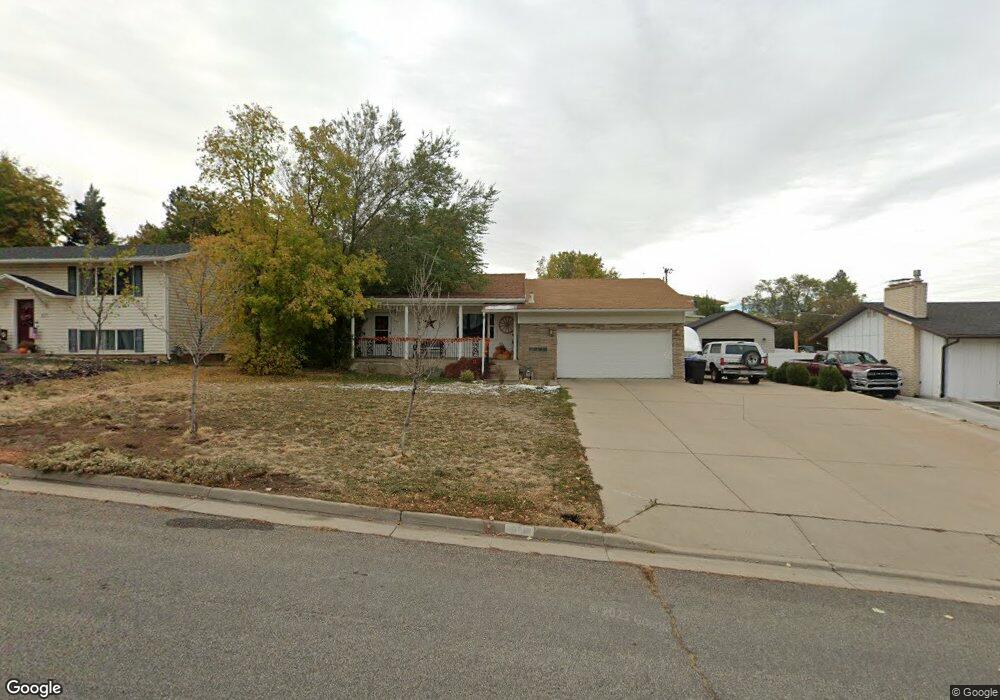
456 E 100 N Centerville, UT 84014
Estimated Value: $512,000 - $615,000
3
Beds
3
Baths
2,241
Sq Ft
$249/Sq Ft
Est. Value
About This Home
This home is located at 456 E 100 N, Centerville, UT 84014 and is currently estimated at $558,681, approximately $249 per square foot. 456 E 100 N is a home located in Davis County with nearby schools including Centerville Elementary, Centerville Jr High, and Viewmont High School.
Ownership History
Date
Name
Owned For
Owner Type
Purchase Details
Closed on
Feb 13, 2014
Sold by
Galloway Berk A and Thomassen Valeen
Bought by
Sadler Jeffrey
Current Estimated Value
Home Financials for this Owner
Home Financials are based on the most recent Mortgage that was taken out on this home.
Original Mortgage
$165,000
Outstanding Balance
$125,042
Interest Rate
4.49%
Mortgage Type
New Conventional
Estimated Equity
$433,639
Purchase Details
Closed on
May 2, 2013
Sold by
Galloway Berk A and Thomassen Valeen
Bought by
Galloway Berk A and Thomassen Valeen
Purchase Details
Closed on
Jan 21, 2009
Sold by
Galloway Beck and Thomassen Valeen
Bought by
Galloway Beck A and Thomassen Valeen
Purchase Details
Closed on
Feb 8, 2005
Sold by
Galloway Berk H
Bought by
Galloway Berk and Thomasson Valeen
Purchase Details
Closed on
Oct 30, 1998
Sold by
Galloway Margie
Bought by
Galloway Berk A
Create a Home Valuation Report for This Property
The Home Valuation Report is an in-depth analysis detailing your home's value as well as a comparison with similar homes in the area
Purchase History
| Date | Buyer | Sale Price | Title Company |
|---|---|---|---|
| Sadler Jeffrey | -- | Founders Title Co L | |
| Galloway Berk A | -- | None Available | |
| Galloway Beck A | -- | None Available | |
| Galloway Berk | -- | -- | |
| Galloway Berk A | -- | -- |
Source: Public Records
Mortgage History
| Date | Status | Borrower | Loan Amount |
|---|---|---|---|
| Open | Sadler Jeffrey | $165,000 |
Source: Public Records
Tax History
| Year | Tax Paid | Tax Assessment Tax Assessment Total Assessment is a certain percentage of the fair market value that is determined by local assessors to be the total taxable value of land and additions on the property. | Land | Improvement |
|---|---|---|---|---|
| 2025 | $3,024 | $289,300 | $172,367 | $116,933 |
| 2024 | $2,872 | $279,400 | $157,150 | $122,250 |
| 2023 | $2,594 | $456,000 | $254,856 | $201,144 |
| 2022 | $2,721 | $263,450 | $129,282 | $134,168 |
| 2021 | $2,414 | $364,000 | $200,617 | $163,383 |
| 2020 | $2,142 | $323,000 | $194,295 | $128,705 |
| 2019 | $2,126 | $313,000 | $189,295 | $123,705 |
| 2018 | $1,973 | $287,000 | $175,352 | $111,648 |
| 2016 | $1,635 | $132,165 | $61,941 | $70,224 |
| 2015 | $1,514 | $115,500 | $61,941 | $53,559 |
| 2014 | $1,362 | $106,302 | $61,941 | $44,361 |
| 2013 | -- | $108,864 | $47,452 | $61,412 |
Source: Public Records
Map
Nearby Homes
Your Personal Tour Guide
Ask me questions while you tour the home.