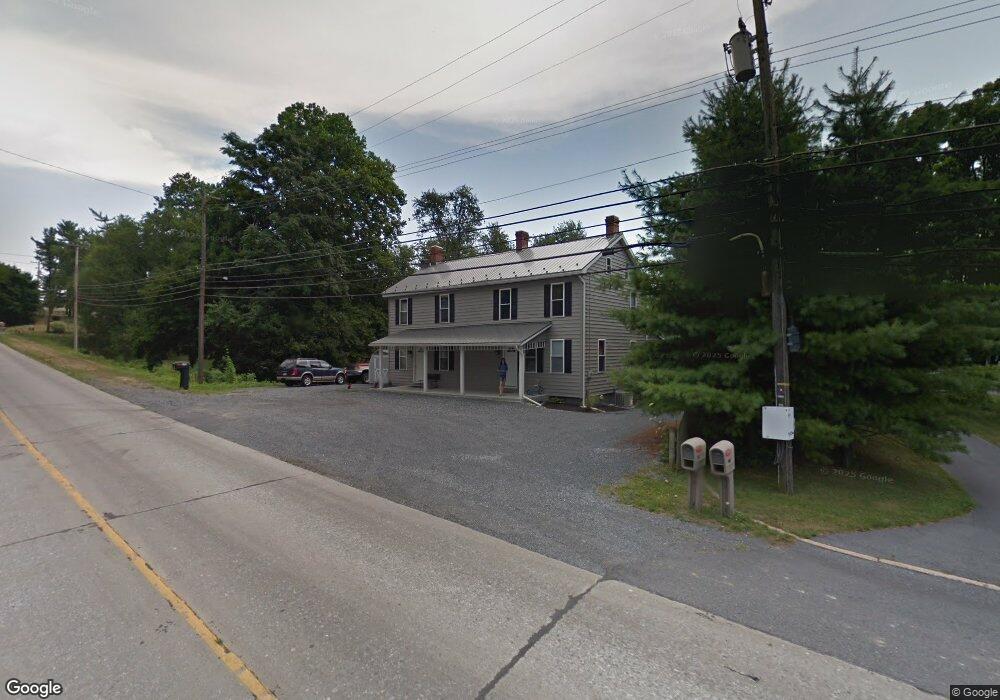
456 E Main Ave Myerstown, PA 17067
Jackson NeighborhoodEstimated Value: $239,000 - $298,000
Studio
2
Baths
2,200
Sq Ft
$122/Sq Ft
Est. Value
About This Home
This home is located at 456 E Main Ave, Myerstown, PA 17067 and is currently estimated at $268,740, approximately $122 per square foot. 456 E Main Ave is a home located in Lebanon County with nearby schools including Eastern Lebanon County Senior High School, Stony Ridge Parochial School, and Myerstown Mennonite School.
Ownership History
Date
Name
Owned For
Owner Type
Purchase Details
Closed on
Jun 6, 2019
Sold by
Baxter Bryan
Bought by
Landis Daniel M and Landis Ashley L
Current Estimated Value
Purchase Details
Closed on
Dec 9, 2015
Sold by
Landis Daniel M and Landis Ashly L
Bought by
Landis Daniel M and Landis Ashly L
Home Financials for this Owner
Home Financials are based on the most recent Mortgage that was taken out on this home.
Original Mortgage
$103,500
Interest Rate
3.77%
Mortgage Type
New Conventional
Purchase Details
Closed on
Nov 29, 2011
Sold by
Dab Associates Llp
Bought by
Landis Daniel M and Landis Ashly L
Home Financials for this Owner
Home Financials are based on the most recent Mortgage that was taken out on this home.
Original Mortgage
$115,500
Interest Rate
4.1%
Mortgage Type
Purchase Money Mortgage
Purchase Details
Closed on
May 7, 2010
Sold by
Hess Allen L and Terrey Kathleen R
Bought by
Us Bank National Association
Create a Home Valuation Report for This Property
The Home Valuation Report is an in-depth analysis detailing your home's value as well as a comparison with similar homes in the area
Home Values in the Area
Average Home Value in this Area
Purchase History
| Date | Buyer | Sale Price | Title Company |
|---|---|---|---|
| Landis Daniel M | $25,000 | None Available | |
| Landis Daniel M | -- | Attorney | |
| Landis Daniel M | $165,000 | None Available | |
| Us Bank National Association | $2,215 | None Available |
Source: Public Records
Mortgage History
| Date | Status | Borrower | Loan Amount |
|---|---|---|---|
| Previous Owner | Landis Daniel M | $103,500 | |
| Previous Owner | Landis Daniel M | $115,500 |
Source: Public Records
Tax History
| Year | Tax Paid | Tax Assessment Tax Assessment Total Assessment is a certain percentage of the fair market value that is determined by local assessors to be the total taxable value of land and additions on the property. | Land | Improvement |
|---|---|---|---|---|
| 2025 | $3,627 | $160,400 | $35,100 | $125,300 |
| 2024 | $3,342 | $160,400 | $35,100 | $125,300 |
| 2023 | $3,342 | $160,400 | $35,100 | $125,300 |
| 2022 | $3,264 | $160,400 | $35,100 | $125,300 |
| 2021 | $3,110 | $160,400 | $35,100 | $125,300 |
| 2020 | $3,066 | $160,400 | $35,100 | $125,300 |
| 2019 | $3,005 | $160,400 | $35,100 | $125,300 |
| 2018 | $2,951 | $160,400 | $35,100 | $125,300 |
| 2017 | $528 | $160,400 | $35,100 | $125,300 |
| 2016 | $2,820 | $160,400 | $35,100 | $125,300 |
| 2015 | -- | $160,400 | $35,100 | $125,300 |
| 2014 | -- | $160,400 | $35,100 | $125,300 |
Source: Public Records
Map
Nearby Homes
- 2 N Willow St
- 651 W Lincoln Ave
- 213 W Maple Ave
- 106 Gable Dr
- 68 Eisenhauer Rd
- 965 N College St
- 14 N Butterfly Dr
- 35 Apple Ln
- 1210 Katterman Hill Rd
- 36 Rosemont Dr
- 15 Lakeview Dr
- 1 Thorndale Dr
- 34 Scenic Dr
- 10 Georgie Ln
- 8 E Market St
- 17 Ketterman Hill Rd
- 49 Clover Dr Unit 65
- 58 Clover Dr Unit 40
- 66 Clover Dr Unit 36
- 62 Clover Dr Unit 38
- 454 E Main Ave
- 462 E Main Ave
- 459 E Main Ave
- 464 E Main Ave
- 3 Quarry Dr
- 313 E Carpenter Ave
- 388 E Main Ave
- 389 E Main Ave
- 466 E Main Ave
- 311 E Carpenter Ave
- 310 E Carpenter Ave
- 318 E Main Ave
- 318 E Main Ave
- 97 Quarry Dr
- 99 Quarry Dr
- 309 E Carpenter Ave
- 309 E Main Ave
- 312 E Main Ave
- 308 E Carpenter Ave
- 101 Quarry Dr
Your Personal Tour Guide
Ask me questions while you tour the home.