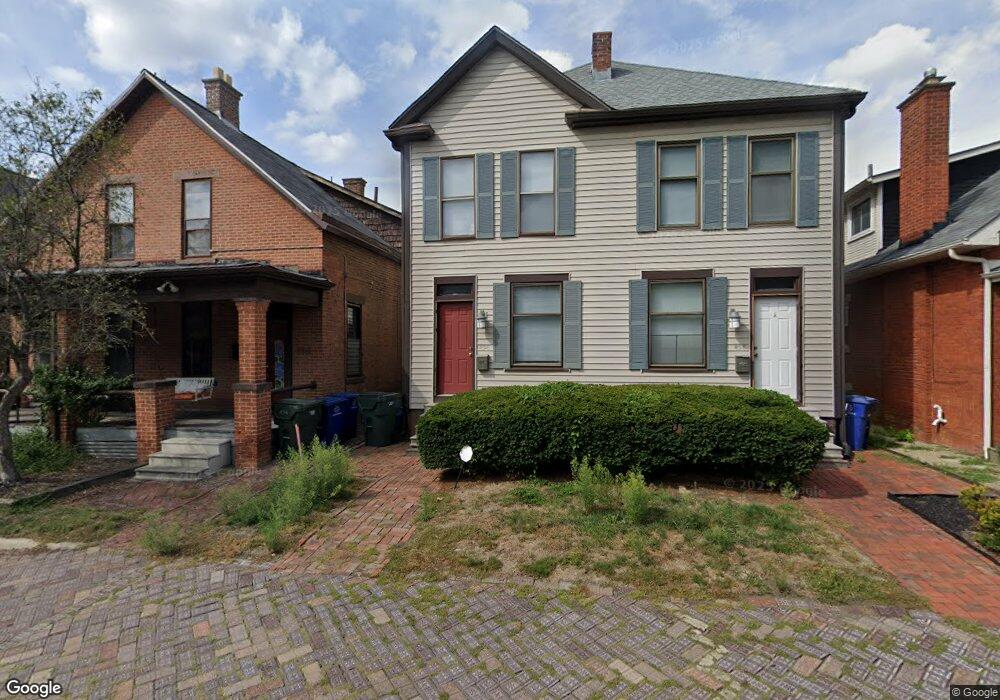
456 E Sycamore St Unit 458 Columbus, OH 43206
Schumacher Place NeighborhoodEstimated Value: $438,092 - $454,000
6
Beds
4
Baths
2,576
Sq Ft
$174/Sq Ft
Est. Value
About This Home
This home is located at 456 E Sycamore St Unit 458, Columbus, OH 43206 and is currently estimated at $448,523, approximately $174 per square foot. 456 E Sycamore St Unit 458 is a home located in Franklin County with nearby schools including Siebert Elementary School, South High School, and South Columbus Preparatory Academy.
Ownership History
Date
Name
Owned For
Owner Type
Purchase Details
Closed on
Jul 22, 2025
Sold by
456 Sycamore Llc
Bought by
Rice Marc A
Current Estimated Value
Home Financials for this Owner
Home Financials are based on the most recent Mortgage that was taken out on this home.
Original Mortgage
$427,500
Outstanding Balance
$426,770
Interest Rate
6.81%
Mortgage Type
Credit Line Revolving
Estimated Equity
$21,753
Purchase Details
Closed on
Feb 8, 2019
Sold by
Tom Wiloughby Llc
Bought by
456 Sycamore Llc
Home Financials for this Owner
Home Financials are based on the most recent Mortgage that was taken out on this home.
Original Mortgage
$307,500
Interest Rate
4.5%
Mortgage Type
Commercial
Purchase Details
Closed on
Feb 29, 2000
Sold by
Willoughby Thomas M and Willoughby Jean Elspeth
Bought by
Tom Willoughby Llc
Purchase Details
Closed on
Jun 22, 1989
Bought by
Willoughby Jean E
Purchase Details
Closed on
Aug 1, 1984
Purchase Details
Closed on
Sep 1, 1978
Create a Home Valuation Report for This Property
The Home Valuation Report is an in-depth analysis detailing your home's value as well as a comparison with similar homes in the area
Home Values in the Area
Average Home Value in this Area
Purchase History
| Date | Buyer | Sale Price | Title Company |
|---|---|---|---|
| Rice Marc A | $450,000 | Ohio Real Title | |
| 456 Sycamore Llc | -- | None Available | |
| Tom Willoughby Llc | -- | The Title Company | |
| Willoughby Thomas M | -- | The Title Company | |
| Willoughby Jean E | -- | -- | |
| -- | -- | -- | |
| -- | $9,900 | -- |
Source: Public Records
Mortgage History
| Date | Status | Borrower | Loan Amount |
|---|---|---|---|
| Open | Rice Marc A | $427,500 | |
| Previous Owner | 456 Sycamore Llc | $307,500 |
Source: Public Records
Tax History
| Year | Tax Paid | Tax Assessment Tax Assessment Total Assessment is a certain percentage of the fair market value that is determined by local assessors to be the total taxable value of land and additions on the property. | Land | Improvement |
|---|---|---|---|---|
| 2025 | $5,147 | $112,320 | $40,570 | $71,750 |
| 2024 | $5,147 | $112,320 | $40,570 | $71,750 |
| 2023 | $5,083 | $112,315 | $40,565 | $71,750 |
| 2022 | $4,779 | $89,920 | $35,180 | $54,740 |
| 2021 | $4,787 | $89,920 | $35,180 | $54,740 |
| 2020 | $4,794 | $89,920 | $35,180 | $54,740 |
| 2019 | $4,384 | $70,500 | $35,180 | $35,320 |
| 2018 | $4,354 | $70,500 | $35,180 | $35,320 |
| 2017 | $4,571 | $70,500 | $35,180 | $35,320 |
| 2016 | $4,758 | $70,040 | $21,700 | $48,340 |
| 2015 | $4,332 | $70,040 | $21,700 | $48,340 |
| 2014 | $4,343 | $70,040 | $21,700 | $48,340 |
| 2013 | $1,947 | $63,665 | $19,740 | $43,925 |
Source: Public Records
Map
Nearby Homes
- 517 Forest St
- 466 South Ln
- 432 E Kossuth St
- 707 Sycamore Place Unit 707
- 320 E Columbus St
- 751 Wager St
- 424 Jackson St
- 616 S Grant Ave Unit 3B
- 385-387 Jackson St
- 497 E Kossuth St
- 626 Jaeger St Unit 7
- 676 Wager St
- 279-281 E Beck St
- 841 Ann St
- 472 E Whittier St
- 242 E Sycamore St
- 253 E Kossuth St Unit 253-H
- 308 Jackson St
- 827 S 17th St
- 630 Stanley Ave
- 452 E Sycamore St Unit 454
- 462 E Sycamore St
- 446 E Sycamore St Unit 448
- 466 E Sycamore St
- 461 Elsmere St Unit 463
- 461-463 Elsmere St
- 457 Elsmere St
- 465 Elsmere St
- 463 Elsmere St
- 444 E Sycamore St
- 470 E Sycamore St Unit 472
- 451 Elsmere St
- 469 Elsmere St
- 474 E Sycamore St Unit 474
- 451 E Sycamore St
- 447-449 Elsmere St
- 447 Elsmere St Unit 49
- 476 E Sycamore St
- 436 E Sycamore St Unit 438
- 438 E Sycamore St
Your Personal Tour Guide
Ask me questions while you tour the home.