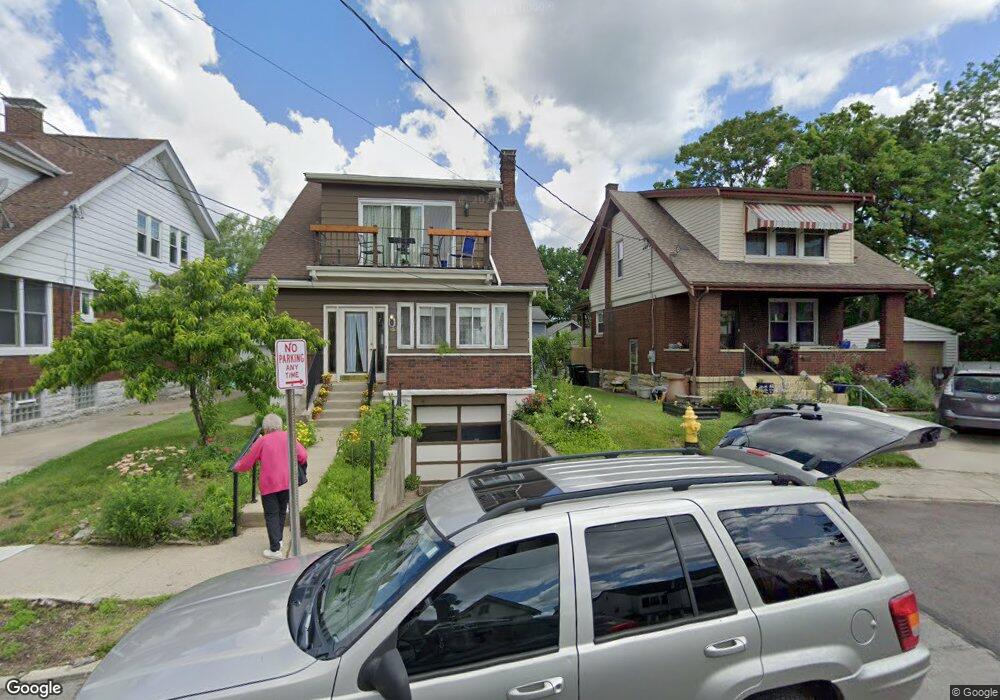
456 Fairview Place Cincinnati, OH 45219
Clifton NeighborhoodEstimated Value: $227,000 - $263,000
3
Beds
1
Bath
1,145
Sq Ft
$216/Sq Ft
Est. Value
About This Home
This home is located at 456 Fairview Place, Cincinnati, OH 45219 and is currently estimated at $247,544, approximately $216 per square foot. 456 Fairview Place is a home located in Hamilton County with nearby schools including Clifton Area Neighborhood School, Robert A. Taft Information Technology High School, and Gilbert A. Dater High School.
Ownership History
Date
Name
Owned For
Owner Type
Purchase Details
Closed on
Aug 31, 2005
Sold by
Curell Amanda A
Bought by
Hatfield Jamey D
Current Estimated Value
Home Financials for this Owner
Home Financials are based on the most recent Mortgage that was taken out on this home.
Original Mortgage
$127,500
Outstanding Balance
$66,863
Interest Rate
5.93%
Mortgage Type
Fannie Mae Freddie Mac
Estimated Equity
$180,681
Purchase Details
Closed on
Jun 23, 2003
Sold by
Adams Louise L
Bought by
Curell Amanda A and Elliott Elizabeth
Home Financials for this Owner
Home Financials are based on the most recent Mortgage that was taken out on this home.
Original Mortgage
$125,600
Interest Rate
5.4%
Mortgage Type
Unknown
Purchase Details
Closed on
Oct 1, 2000
Sold by
Helton Gladys M and Helton Gladys
Bought by
Adams Louise L
Home Financials for this Owner
Home Financials are based on the most recent Mortgage that was taken out on this home.
Original Mortgage
$145,500
Interest Rate
8.03%
Create a Home Valuation Report for This Property
The Home Valuation Report is an in-depth analysis detailing your home's value as well as a comparison with similar homes in the area
Home Values in the Area
Average Home Value in this Area
Purchase History
| Date | Buyer | Sale Price | Title Company |
|---|---|---|---|
| Hatfield Jamey D | -- | None Available | |
| Curell Amanda A | $157,000 | -- | |
| Adams Louise L | $150,000 | Classic Title Agency Inc |
Source: Public Records
Mortgage History
| Date | Status | Borrower | Loan Amount |
|---|---|---|---|
| Open | Hatfield Jamey D | $127,500 | |
| Previous Owner | Curell Amanda A | $125,600 | |
| Previous Owner | Adams Louise L | $145,500 |
Source: Public Records
Tax History
| Year | Tax Paid | Tax Assessment Tax Assessment Total Assessment is a certain percentage of the fair market value that is determined by local assessors to be the total taxable value of land and additions on the property. | Land | Improvement |
|---|---|---|---|---|
| 2025 | $4,632 | $75,149 | $17,325 | $57,824 |
| 2023 | $4,595 | $75,149 | $17,325 | $57,824 |
| 2022 | $3,649 | $53,494 | $9,877 | $43,617 |
| 2021 | $3,515 | $53,494 | $9,877 | $43,617 |
| 2020 | $3,614 | $53,494 | $9,877 | $43,617 |
| 2019 | $3,466 | $46,925 | $8,663 | $38,262 |
| 2018 | $3,471 | $46,925 | $8,663 | $38,262 |
| 2017 | $3,300 | $46,925 | $8,663 | $38,262 |
| 2016 | $3,991 | $55,948 | $8,743 | $47,205 |
| 2015 | $3,596 | $55,948 | $8,743 | $47,205 |
| 2014 | $3,621 | $55,948 | $8,743 | $47,205 |
| 2013 | $3,321 | $50,400 | $7,875 | $42,525 |
Source: Public Records
Map
Nearby Homes
- 447 Warner St
- 440 Warner St
- 454 Klotter Ave
- 420 Warner St
- 2367 Fairview Ave
- 456 W McMicken Ave
- 2128 Ravine St
- 2125 Renner Place
- 2123 Renner Place
- 421 W McMicken Ave
- 407 Mohawk St
- 2171 Sohn St
- 411 W McMicken Ave
- 2355 W McMicken Ave
- 310 Klotter Ave
- 2462 Fairview Ave
- 320 Mohawk St
- 306 Klotter Ave
- 266 Klotter Ave
- 255 Warner St
- 451 Lloyd Place
- 454 Fairview Place
- 458 Fairview Place
- 449 Lloyd Place
- 460 Fairview Place
- 453 Lloyd Place
- 452 Fairview Place
- 462 Fairview Place
- 455 Lloyd Place
- 451 Fairview Place
- 448 Lloyd Place
- 457 Lloyd Place
- 449 Fairview Place
- 464 Fairview Place
- 453 Fairview Place
- 461 Lloyd Place
- 455 Fairview Place
- 452 Lloyd Place
- 466 Fairview Place
- 454 Lloyd Place
Your Personal Tour Guide
Ask me questions while you tour the home.