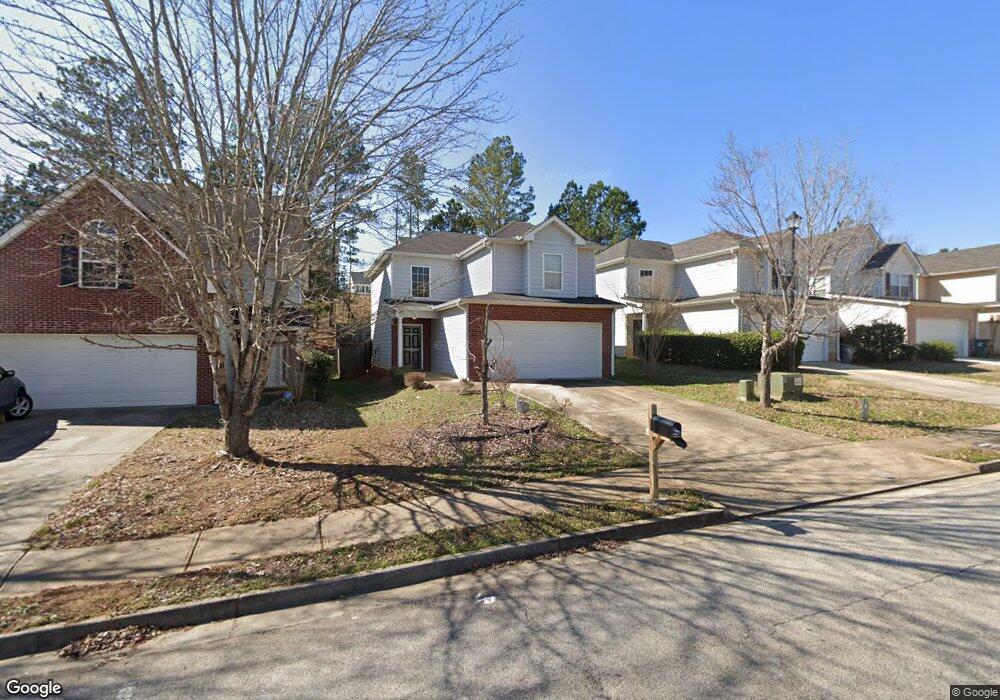
456 Kirkland Dr Unit 811 Locust Grove, GA 30248
Estimated Value: $240,000 - $265,831
3
Beds
3
Baths
1,583
Sq Ft
$159/Sq Ft
Est. Value
About This Home
This home is located at 456 Kirkland Dr Unit 811, Locust Grove, GA 30248 and is currently estimated at $251,958, approximately $159 per square foot. 456 Kirkland Dr Unit 811 is a home located in Henry County with nearby schools including Locust Grove Elementary School, Locust Grove Middle School, and Locust Grove High School.
Ownership History
Date
Name
Owned For
Owner Type
Purchase Details
Closed on
Jan 15, 2020
Sold by
Jocelyn Marie S
Bought by
Trans Am Sfe Ii Llc
Current Estimated Value
Purchase Details
Closed on
Dec 5, 2014
Sold by
Dickerson Craig
Bought by
Jocelyn Marie S and Jocelyn Jean R
Home Financials for this Owner
Home Financials are based on the most recent Mortgage that was taken out on this home.
Original Mortgage
$85,913
Interest Rate
4.25%
Mortgage Type
FHA
Purchase Details
Closed on
Jun 12, 2014
Sold by
Greer Arthur B
Bought by
Dickerson Craig
Purchase Details
Closed on
Nov 23, 2009
Sold by
United Cmnty Bk
Bought by
Greer Arthur B
Home Financials for this Owner
Home Financials are based on the most recent Mortgage that was taken out on this home.
Original Mortgage
$66,348
Interest Rate
4.98%
Mortgage Type
FHA
Purchase Details
Closed on
Oct 7, 2008
Sold by
Edson Tanger Ridge Llc
Bought by
United Community Bank
Create a Home Valuation Report for This Property
The Home Valuation Report is an in-depth analysis detailing your home's value as well as a comparison with similar homes in the area
Home Values in the Area
Average Home Value in this Area
Purchase History
| Date | Buyer | Sale Price | Title Company |
|---|---|---|---|
| Trans Am Sfe Ii Llc | $140,000 | -- | |
| Jocelyn Marie S | $87,500 | -- | |
| Dickerson Craig | $75,000 | -- | |
| Greer Arthur B | $79,300 | -- | |
| United Community Bank | $608,476 | -- |
Source: Public Records
Mortgage History
| Date | Status | Borrower | Loan Amount |
|---|---|---|---|
| Previous Owner | Jocelyn Marie S | $85,913 | |
| Previous Owner | Greer Arthur B | $66,348 |
Source: Public Records
Tax History Compared to Growth
Tax History
| Year | Tax Paid | Tax Assessment Tax Assessment Total Assessment is a certain percentage of the fair market value that is determined by local assessors to be the total taxable value of land and additions on the property. | Land | Improvement |
|---|---|---|---|---|
| 2025 | $3,681 | $94,320 | $16,000 | $78,320 |
| 2024 | $3,681 | $108,360 | $16,000 | $92,360 |
| 2023 | $3,924 | $108,240 | $16,000 | $92,240 |
| 2022 | $2,984 | $81,520 | $16,000 | $65,520 |
| 2021 | $2,066 | $56,000 | $14,168 | $41,832 |
| 2020 | $276 | $58,680 | $13,000 | $45,680 |
| 2019 | $288 | $53,440 | $12,000 | $41,440 |
| 2018 | $0 | $47,720 | $9,200 | $38,520 |
| 2016 | $281 | $37,320 | $8,000 | $29,320 |
| 2015 | $1,319 | $33,920 | $7,200 | $26,720 |
| 2014 | $1,123 | $28,680 | $6,200 | $22,480 |
Source: Public Records
Map
Nearby Homes
- 456 Kirkland Dr
- 462 Kirkland Dr
- 452 Kirkland Dr
- 470 Kirkland Dr
- 444 Kirkland Dr
- 210 Aster Ave
- 210 Aster Ave Unit 114
- 214 Aster Ave Unit 115
- 440 Kirkland Dr
- 206 Aster Ave Unit 113
- 474 Kirkland Dr
- 474 Kirkland Dr Unit 815
- 218 Aster Ave Unit 116
- 218 Aster Ave
- 449 Kirkland Dr
- 438 Kirkland Dr
- 445 Kirkland Dr
- 457 Kirkland Dr Unit 865
- 453 Kirkland Dr Unit 866