456 Moore St Ludlow, MA 01056
Estimated Value: $681,000 - $782,000
3
Beds
3
Baths
2,903
Sq Ft
$253/Sq Ft
Est. Value
About This Home
This home is located at 456 Moore St, Ludlow, MA 01056 and is currently estimated at $735,694, approximately $253 per square foot. 456 Moore St is a home located in Hampden County with nearby schools including East Street Elementary School, Chapin Street Elementary School, and Paul R. Baird Middle School.
Ownership History
Date
Name
Owned For
Owner Type
Purchase Details
Closed on
Aug 1, 2005
Sold by
Mccready Howard B and Mccready Lynn L
Bought by
Jacques Denise M and Jacques Robert T
Current Estimated Value
Home Financials for this Owner
Home Financials are based on the most recent Mortgage that was taken out on this home.
Original Mortgage
$359,600
Outstanding Balance
$189,024
Interest Rate
5.67%
Mortgage Type
Purchase Money Mortgage
Estimated Equity
$546,670
Create a Home Valuation Report for This Property
The Home Valuation Report is an in-depth analysis detailing your home's value as well as a comparison with similar homes in the area
Home Values in the Area
Average Home Value in this Area
Purchase History
| Date | Buyer | Sale Price | Title Company |
|---|---|---|---|
| Jacques Denise M | $455,000 | -- |
Source: Public Records
Mortgage History
| Date | Status | Borrower | Loan Amount |
|---|---|---|---|
| Open | Jacques Denise M | $359,600 |
Source: Public Records
Tax History
| Year | Tax Paid | Tax Assessment Tax Assessment Total Assessment is a certain percentage of the fair market value that is determined by local assessors to be the total taxable value of land and additions on the property. | Land | Improvement |
|---|---|---|---|---|
| 2025 | $9,501 | $547,600 | $101,500 | $446,100 |
| 2024 | $9,488 | $524,500 | $101,700 | $422,800 |
| 2023 | $9,158 | $469,400 | $84,500 | $384,900 |
| 2022 | $8,652 | $432,800 | $84,500 | $348,300 |
| 2021 | $8,567 | $406,400 | $84,500 | $321,900 |
| 2020 | $8,277 | $401,400 | $83,200 | $318,200 |
| 2019 | $7,857 | $396,400 | $82,400 | $314,000 |
| 2018 | $7,556 | $397,500 | $91,600 | $305,900 |
| 2017 | $7,275 | $392,600 | $89,600 | $303,000 |
| 2016 | $7,221 | $398,300 | $87,700 | $310,600 |
| 2015 | $6,828 | $394,900 | $86,900 | $308,000 |
Source: Public Records
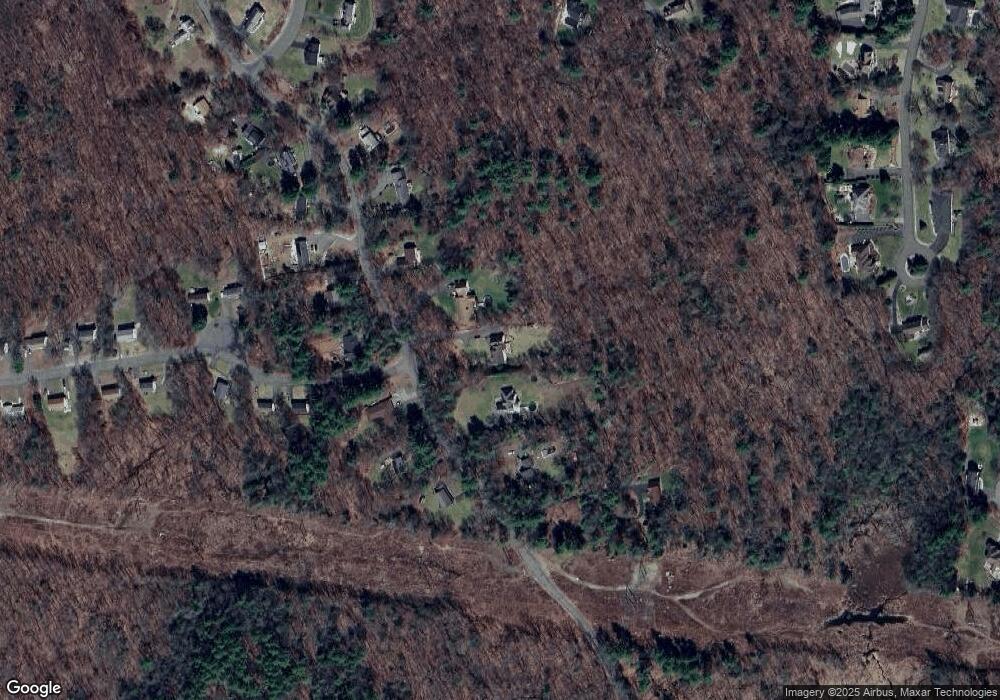
Map
Nearby Homes
- 429 Moore St
- Lot B Woodland Cir
- 140 Waverly Rd
- 625 Alden St
- 143 James St
- 1172 East St
- 30 Red Bridge Rd Land Lot 3
- 30 Red Bridge Rd Land Lot 1
- 30 Red Bridge Rd Land Lot 6
- 30 Red Bridge Rd Land Lot 8
- 30 Red Bridge Rd Land Lot 4
- 30 Red Bridge Rd Land Lot 5
- 30 Red Bridge Rd Land Lot 7
- Lot 28 Tower Rd
- 517 S Washington St
- 980 Center St
- Lot 88 Turning Leaf Equinox Pass
- 22 Balsam Hill Rd
- 308 Miller St Unit 79
- 308 Miller St Unit 78
- 434 Moore St
- 484 Moore St
- Lot 52 Moore St
- Lt699 Moore St
- 699 Moore St
- Lot 9 Moore St
- 418 Moore St
- 490 Moore St
- 441 Moore St Unit 443
- 459 Moore St Unit 461
- 407 Moore St Unit 409
- 473 Moore St Unit 475
- 498 Moore St
- 25 Minechoag Heights Unit 27
- 412 Moore St
- 487 Moore St
- 41 Minechoag Heights Unit 43
- 514 Moore St
- 501 Moore St
- 41-43 Minechoag Heights
Your Personal Tour Guide
Ask me questions while you tour the home.