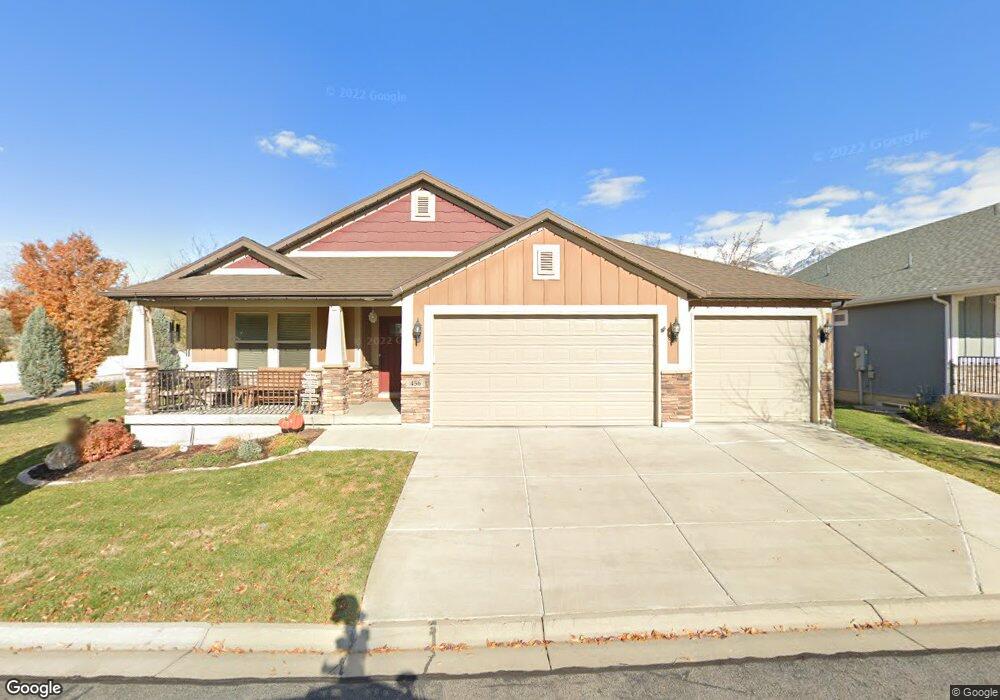
456 N 1025 E Layton, UT 84040
Estimated Value: $657,790 - $716,000
5
Beds
3
Baths
1,924
Sq Ft
$358/Sq Ft
Est. Value
About This Home
This home is located at 456 N 1025 E, Layton, UT 84040 and is currently estimated at $688,948, approximately $358 per square foot. 456 N 1025 E is a home with nearby schools including Whitesides Elementary School, Central Davis Junior High School, and Layton High School.
Ownership History
Date
Name
Owned For
Owner Type
Purchase Details
Closed on
Jul 25, 2014
Sold by
Moore Darrell G and Moore Mary Elaine
Bought by
Darrell And Mary Elaine Moore Family Tru and Moore Mary Elaine
Current Estimated Value
Purchase Details
Closed on
Feb 4, 2013
Sold by
Moore Darrell and Moore Mary
Bought by
Moore Darrell G and Moore Mary Elaine
Home Financials for this Owner
Home Financials are based on the most recent Mortgage that was taken out on this home.
Original Mortgage
$271,090
Outstanding Balance
$188,137
Interest Rate
3.33%
Mortgage Type
Construction
Estimated Equity
$500,811
Create a Home Valuation Report for This Property
The Home Valuation Report is an in-depth analysis detailing your home's value as well as a comparison with similar homes in the area
Home Values in the Area
Average Home Value in this Area
Purchase History
| Date | Buyer | Sale Price | Title Company |
|---|---|---|---|
| Darrell And Mary Elaine Moore Family Tru | -- | None Available | |
| Moore Darrell G | -- | Bonneville Superior Title Co | |
| Moore Darrell | -- | Bonneville Superior Title Co | |
| Nilson And Company Inc | -- | Bonneville Superior Title |
Source: Public Records
Mortgage History
| Date | Status | Borrower | Loan Amount |
|---|---|---|---|
| Open | Moore Darrell | $271,090 |
Source: Public Records
Tax History
| Year | Tax Paid | Tax Assessment Tax Assessment Total Assessment is a certain percentage of the fair market value that is determined by local assessors to be the total taxable value of land and additions on the property. | Land | Improvement |
|---|---|---|---|---|
| 2025 | $3,416 | $358,600 | $90,750 | $267,850 |
| 2024 | $3,272 | $345,950 | $57,750 | $288,200 |
| 2023 | $3,364 | $627,000 | $102,000 | $525,000 |
| 2022 | $3,695 | $374,000 | $59,950 | $314,050 |
| 2021 | $3,054 | $461,000 | $95,000 | $366,000 |
| 2020 | $2,741 | $397,000 | $69,500 | $327,500 |
| 2019 | $2,658 | $377,000 | $66,800 | $310,200 |
| 2018 | $2,444 | $348,000 | $66,800 | $281,200 |
| 2016 | $2,463 | $180,950 | $23,100 | $157,850 |
| 2015 | $2,417 | $168,575 | $23,100 | $145,475 |
| 2014 | $2,308 | $164,545 | $23,100 | $141,445 |
| 2013 | -- | $42,000 | $42,000 | $0 |
Source: Public Records
Map
Nearby Homes
- 508 N Adamswood Rd
- 431 N 1050 E
- 556 N Fairfield Rd Unit A2
- 556 N Fairfield Rd Unit D1
- 556 N Fairfield Rd Unit D2
- 556 N Fairfield Rd Unit A3
- 556 N Fairfield Rd Unit D3
- 556 N Fairfield Rd Unit D4
- 556 N Fairfield Rd Unit A1
- 556 N Fairfield Rd Unit A4
- 861 E 575 N
- 857 E 575 N
- 479 N 1375 E
- 187 N Talbot Dr
- 800 Kirk St
- 654 Colonial St
- 1503 E 530 N
- 997 E 825 N
- 618 Valeria Dr
- 942 E Gentile St