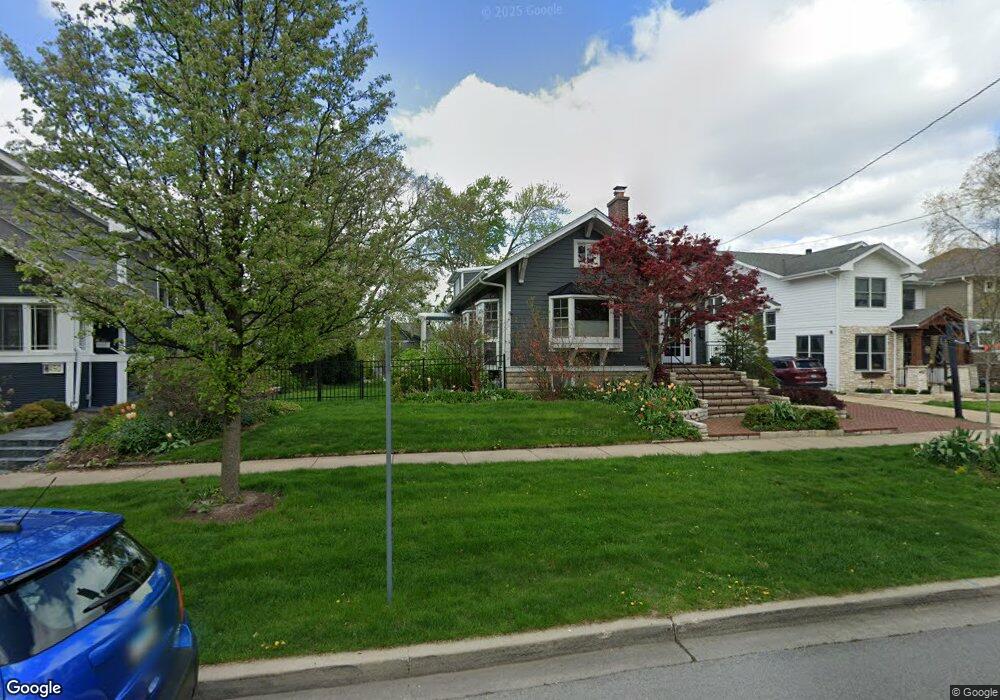
456 Phillips Ave Glen Ellyn, IL 60137
Estimated Value: $726,000 - $980,000
3
Beds
3
Baths
2,216
Sq Ft
$388/Sq Ft
Est. Value
About This Home
This home is located at 456 Phillips Ave, Glen Ellyn, IL 60137 and is currently estimated at $858,913, approximately $387 per square foot. 456 Phillips Ave is a home located in DuPage County with nearby schools including Abraham Lincoln Elementary School, Hadley Junior High School, and Glenbard West High School.
Ownership History
Date
Name
Owned For
Owner Type
Purchase Details
Closed on
Apr 30, 2004
Sold by
Prickett David C and Prickett Kimberly A
Bought by
Setterdahl Christer and Setterdahl Jacqueline
Current Estimated Value
Home Financials for this Owner
Home Financials are based on the most recent Mortgage that was taken out on this home.
Original Mortgage
$553,600
Outstanding Balance
$245,800
Interest Rate
4.75%
Mortgage Type
Purchase Money Mortgage
Estimated Equity
$613,113
Purchase Details
Closed on
Mar 24, 2004
Sold by
Prickett Kimberly A and Kimberly A Prickett Revocable
Bought by
Prickett David C and Prickett Kimberly A
Home Financials for this Owner
Home Financials are based on the most recent Mortgage that was taken out on this home.
Original Mortgage
$553,600
Outstanding Balance
$245,800
Interest Rate
4.75%
Mortgage Type
Purchase Money Mortgage
Estimated Equity
$613,113
Purchase Details
Closed on
Apr 26, 1996
Sold by
Jensen Harold O and Jensen Nancy O
Bought by
Seaholm Steven P and Seaholm Ruth M
Home Financials for this Owner
Home Financials are based on the most recent Mortgage that was taken out on this home.
Original Mortgage
$168,300
Interest Rate
8.1%
Mortgage Type
Balloon
Create a Home Valuation Report for This Property
The Home Valuation Report is an in-depth analysis detailing your home's value as well as a comparison with similar homes in the area
Home Values in the Area
Average Home Value in this Area
Purchase History
| Date | Buyer | Sale Price | Title Company |
|---|---|---|---|
| Setterdahl Christer | $692,000 | Multiple | |
| Prickett David C | -- | -- | |
| Seaholm Steven P | $198,000 | -- |
Source: Public Records
Mortgage History
| Date | Status | Borrower | Loan Amount |
|---|---|---|---|
| Open | Setterdahl Christer | $553,600 | |
| Previous Owner | Prickett David C | $226,700 | |
| Previous Owner | Seaholm Steven P | $168,300 |
Source: Public Records
Tax History Compared to Growth
Tax History
| Year | Tax Paid | Tax Assessment Tax Assessment Total Assessment is a certain percentage of the fair market value that is determined by local assessors to be the total taxable value of land and additions on the property. | Land | Improvement |
|---|---|---|---|---|
| 2024 | $16,092 | $241,246 | $28,453 | $212,793 |
| 2023 | $15,341 | $222,060 | $26,190 | $195,870 |
| 2022 | $15,264 | $209,860 | $24,750 | $185,110 |
| 2021 | $14,683 | $204,880 | $24,160 | $180,720 |
| 2020 | $12,567 | $202,970 | $23,930 | $179,040 |
| 2019 | $12,240 | $197,620 | $23,300 | $174,320 |
| 2018 | $12,154 | $195,130 | $31,420 | $163,710 |
| 2017 | $11,905 | $187,930 | $30,260 | $157,670 |
| 2016 | $11,160 | $145,290 | $29,050 | $116,240 |
| 2015 | $11,147 | $138,600 | $27,710 | $110,890 |
| 2014 | $10,952 | $131,570 | $41,460 | $90,110 |
| 2013 | $10,662 | $131,960 | $41,580 | $90,380 |
Source: Public Records
Map
Nearby Homes
- 451 Duane St
- 360 N Main St
- 404 Melrose Ave Unit 204
- 418 Hill Ave
- 462 Pennsylvania Ave Unit 4S
- 416 Anthony St
- 534 Western Ave
- 504 Newton Ave
- 331 Lorraine St
- 441 N Park Blvd Unit 3E
- 441 N Park Blvd Unit 3I
- 606 Lakeview Terrace
- 567 Deerpath Rd
- 505 Kenilworth Ave Unit 4
- 460 Pennsylvania Ave Unit C
- 369 Hawthorne Blvd
- 553 N Kenilworth Ave
- 566 Glendale Ave
- 670 Revere Rd
- 734 Highview Ave
- 450 Phillips Ave
- 462 Phillips Ave
- 457 Hillside Ave
- 466 Phillips Ave
- 395 Prospect Ave
- 459 Hillside Ave
- 465 Hillside Ave
- 384 Prospect Ave
- 388 Prospect Ave
- 455 Phillips Ave
- 470 Phillips Ave
- 467 Hillside Ave
- 461 Phillips Ave
- 461 Phillips Ave
- 461 Phillips Ave
- 461 Phillips Ave
- 392 Prospect Ave
- 396 Prospect Ave
- 471 Hillside Ave
- 474 Phillips Ave